
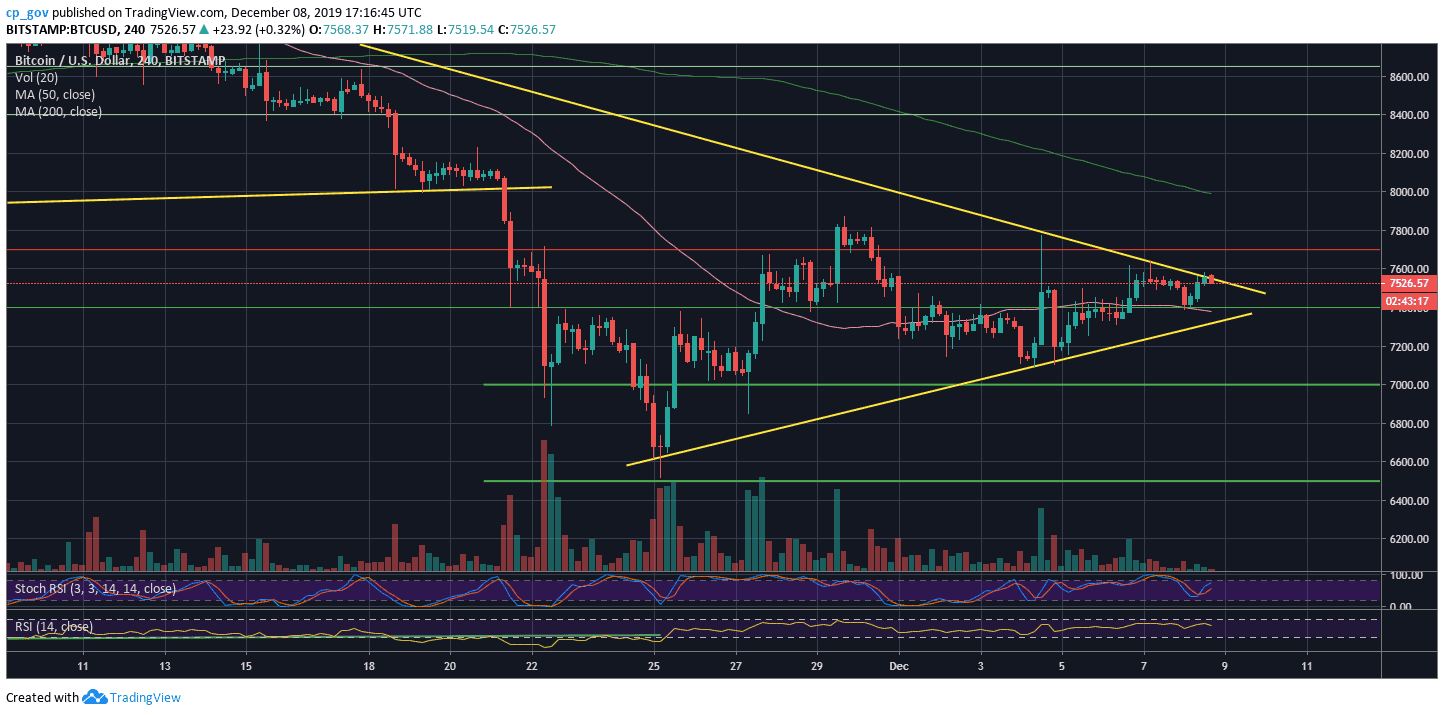
The last days saw Bitcoin trading under a tight range of $300, between $7300 and $7600.
The good news is that Bitcoin is finally trading above the confluence zone of $7300 – $7400, along with the 4-hour MA-50, which was mentioned here more than once.
Besides, the RSI is showing strength due to the negative divergence shown on both the following charts.
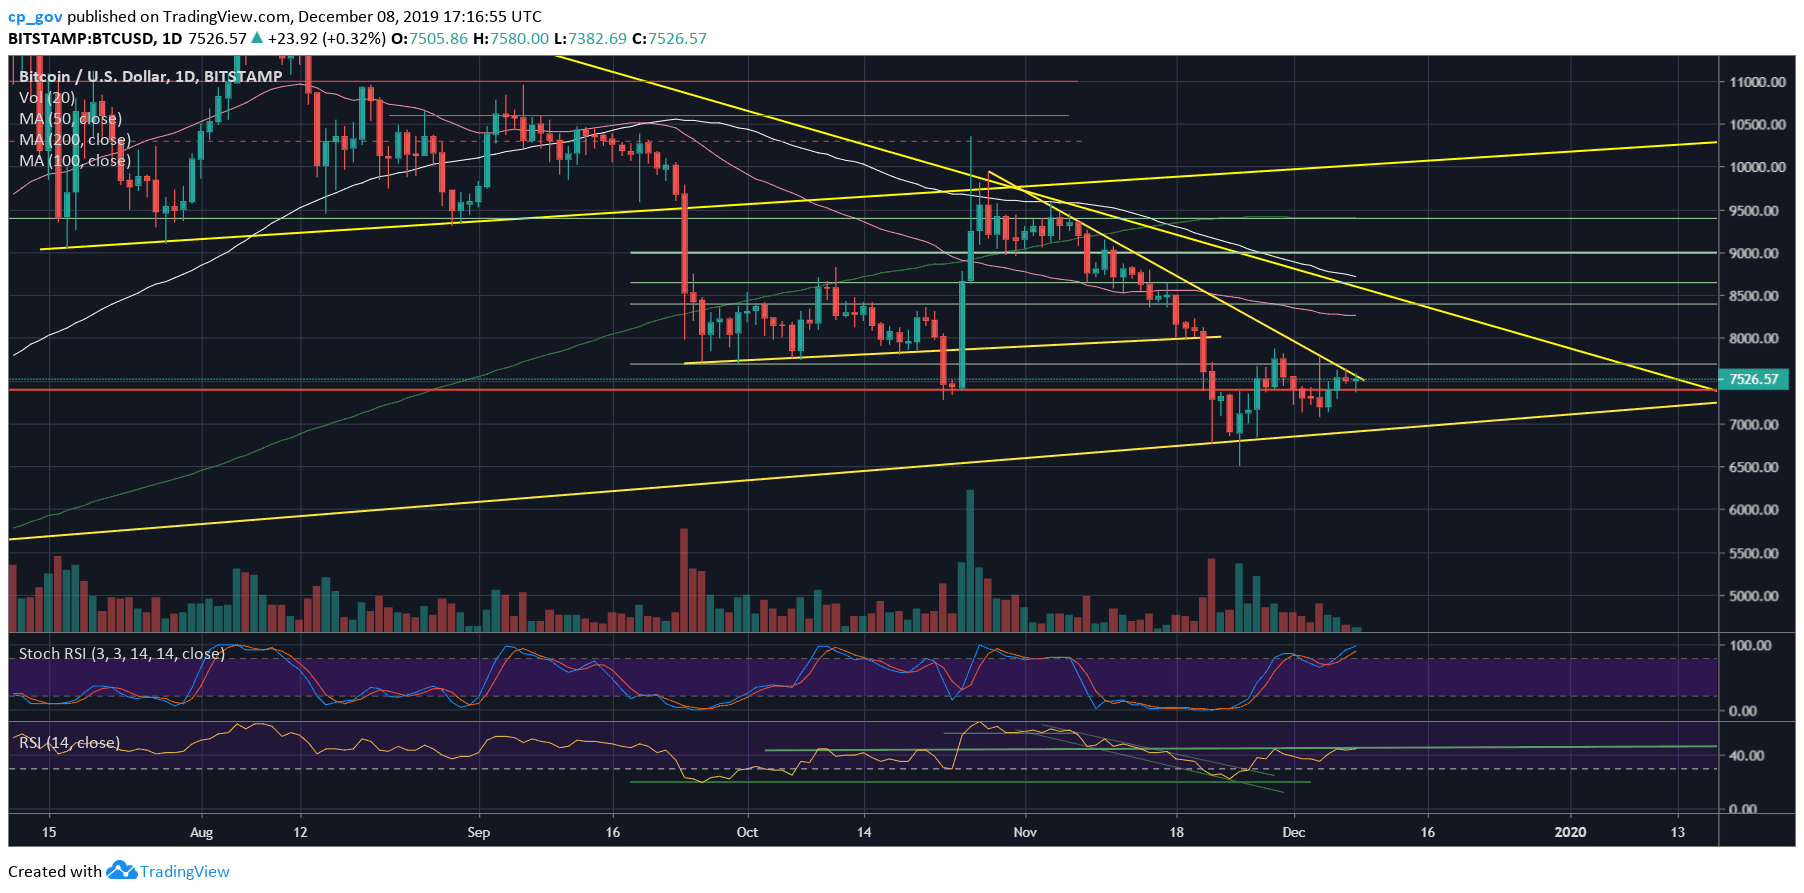
However, Bitcoin is now facing a critical decision as the coin reaching a mid-term descending trend-line. This can be seen on both the following 4-hour and the 1-day charts. The decision is also reflected on the daily RSI, which is facing the critical 45-resistance resistance line.
For almost a month, Bitcoin 1-day’s RSI couldn’t breach the 45 levels. As the weekend ends, and a new week starts, we can expect a volatile Monday ahead of us.
Total Market Cap: $205 billion
Bitcoin Market Cap: $136.8 billion
BTC Dominance Index: 66.7%
*Data by CoinGecko
Key Levels to Watch
– Support/Resistance: As mentioned above, Bitcoin is now facing the descending trend-line resistance. The next level is the $7700 – $7800 horizontal resistance. If Bitcoin can make it, further above lies $8000 and $8300.
From below, the first support is the 4-hour’s MA-50 line, marked by a pink line, along with horizontal support of $7300 – $7400, and an ascending trend-line on the 4-hour chart. Further below is the $7000 support, $6800, and the 6-month low around $6500.
– The RSI Indicator: As discussed above.
– Trading volume: Bitcoin had seen four consecutive days of a declining trading volume. This is another sign of a coming-up price move in the short-term.
BTC/USD BitStamp 4-Hour Chart
BTC/USD BitStamp 1-Day Chart
Disclaimer: Information found on CryptoPotato is those of writers quoted. It does not represent the opinions of CryptoPotato on whether to buy, sell, or hold any investments. You are advised to conduct your own research before making any investment decisions. Use provided information at your own risk. See Disclaimer for more information.
Cryptocurrency charts by TradingView.
Technical analysis tools by Coinigy.
You might also like:
The post appeared first on CryptoPotato


