
Bitcoin price is showing positive signs and settled above $10,000 against the US Dollar.The price is now trading near the key $10,400 resistance area, which is preventing gains.Yesterday’s highlighted important bearish trend line is acting as a solid resistance near $10,420 on the hourly chart of the BTC/USD pair (data feed from Kraken).The price is likely setting up for the next key break either above $10,500 or below $10,250.Bitcoin price is trading with a positive bias above $10,200 against the US Dollar. However, BTC must surge above $10,400 and $10,500 to move into an uptrend.Bitcoin Price AnalysisIn the past few sessions, there was a steady recovery in BTC above $10,000 against the US Dollar. The price even traded above the $10,200 and $10,250 resistance levels. Moreover, there was a close above the $10,200 level and the 100 hourly simple moving average. As a result, there was a decent recovery in many altcoins as well, including Ethereum, ripple, ETC, bitcoin cash and EOS.Bitcoin price gained pace above the 23.6% Fib retracement level of the key decline from the $10,975 swing high to $9,757 low. The recent wave was such that the price even spiked above the $10,400 level. Moreover, there was a break above the 50% Fib retracement level of the key decline from the $10,975 swing high to $9,757 low. However, the bulls faced a strong resistance just below the $10,500 level.Additionally, yesterday’s highlighted important bearish trend line is acting as a solid resistance near $10,420 on the hourly chart of the BTC/USD pair. The pair is now consolidating below the trend line and the $10,500 resistance. Moreover, the 61.8% Fib retracement level of the key decline from the $10,975 swing high to $9,757 low is at $10,510.Therefore, the price could rally if it breaks the trend line and the $10,500 resistance area. The next stop for the bulls could be near the $11,000 resistance area in the near term. On the other hand, an immediate key support is near the $10,250 level. If there is a downside break below the $10,250 support, the price could start a fresh decline in the coming sessions.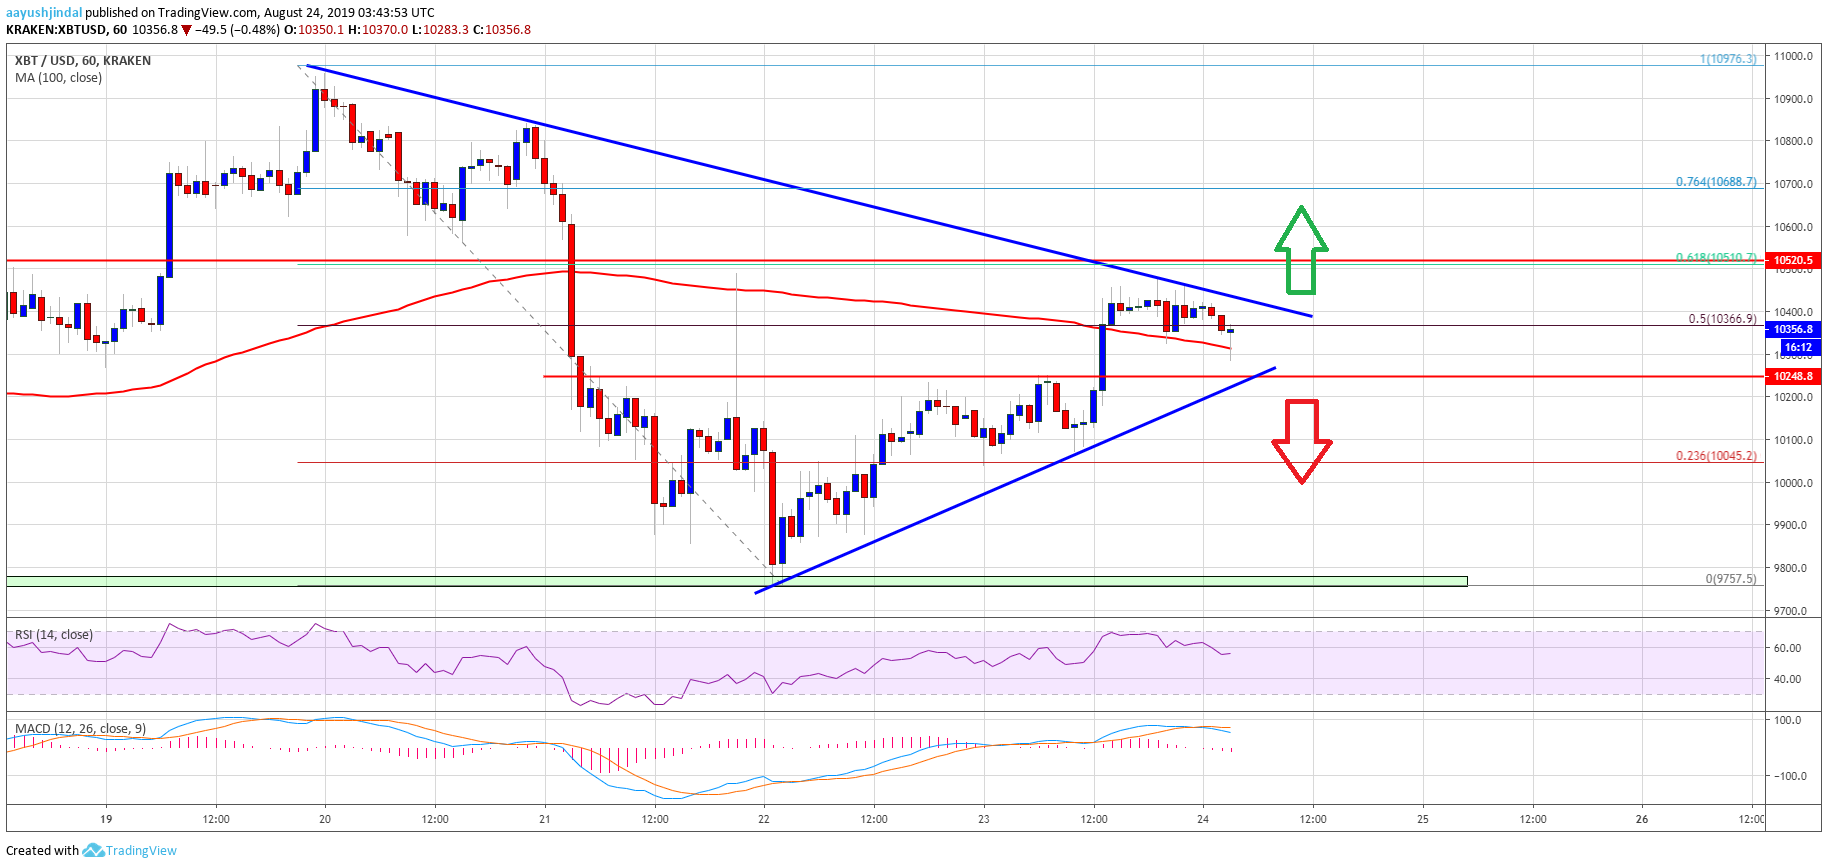 Looking at the chart, bitcoin price is clearly setting up for the next key break either above $10,500 or below $10,250. There are high chances of a fresh bearish wave as long as the price is below the $10,500 pivot area.Technical indicators:Hourly MACD – The MACD is slowly losing momentum in the bullish zone.Hourly RSI (Relative Strength Index) – The RSI for BTC/USD is currently above the 50 level.Major Support Levels – $10,250 followed by $10,000.Major Resistance Levels – $10,420, $10,500 and $10,680.The post appeared first on NewsBTC


