
January 7 was a momentous day for Bitcoin, having finally crossed the $8000 level for the first time since late-November. With such a great start to 2020, Bitcoin could have more surprising upward price movements in store. BTC was valued at around $8100 at the time of writing, and indicators show the price could move further up in the coming weeks.
1-hour chart
Source: BTCUSD on TradingView
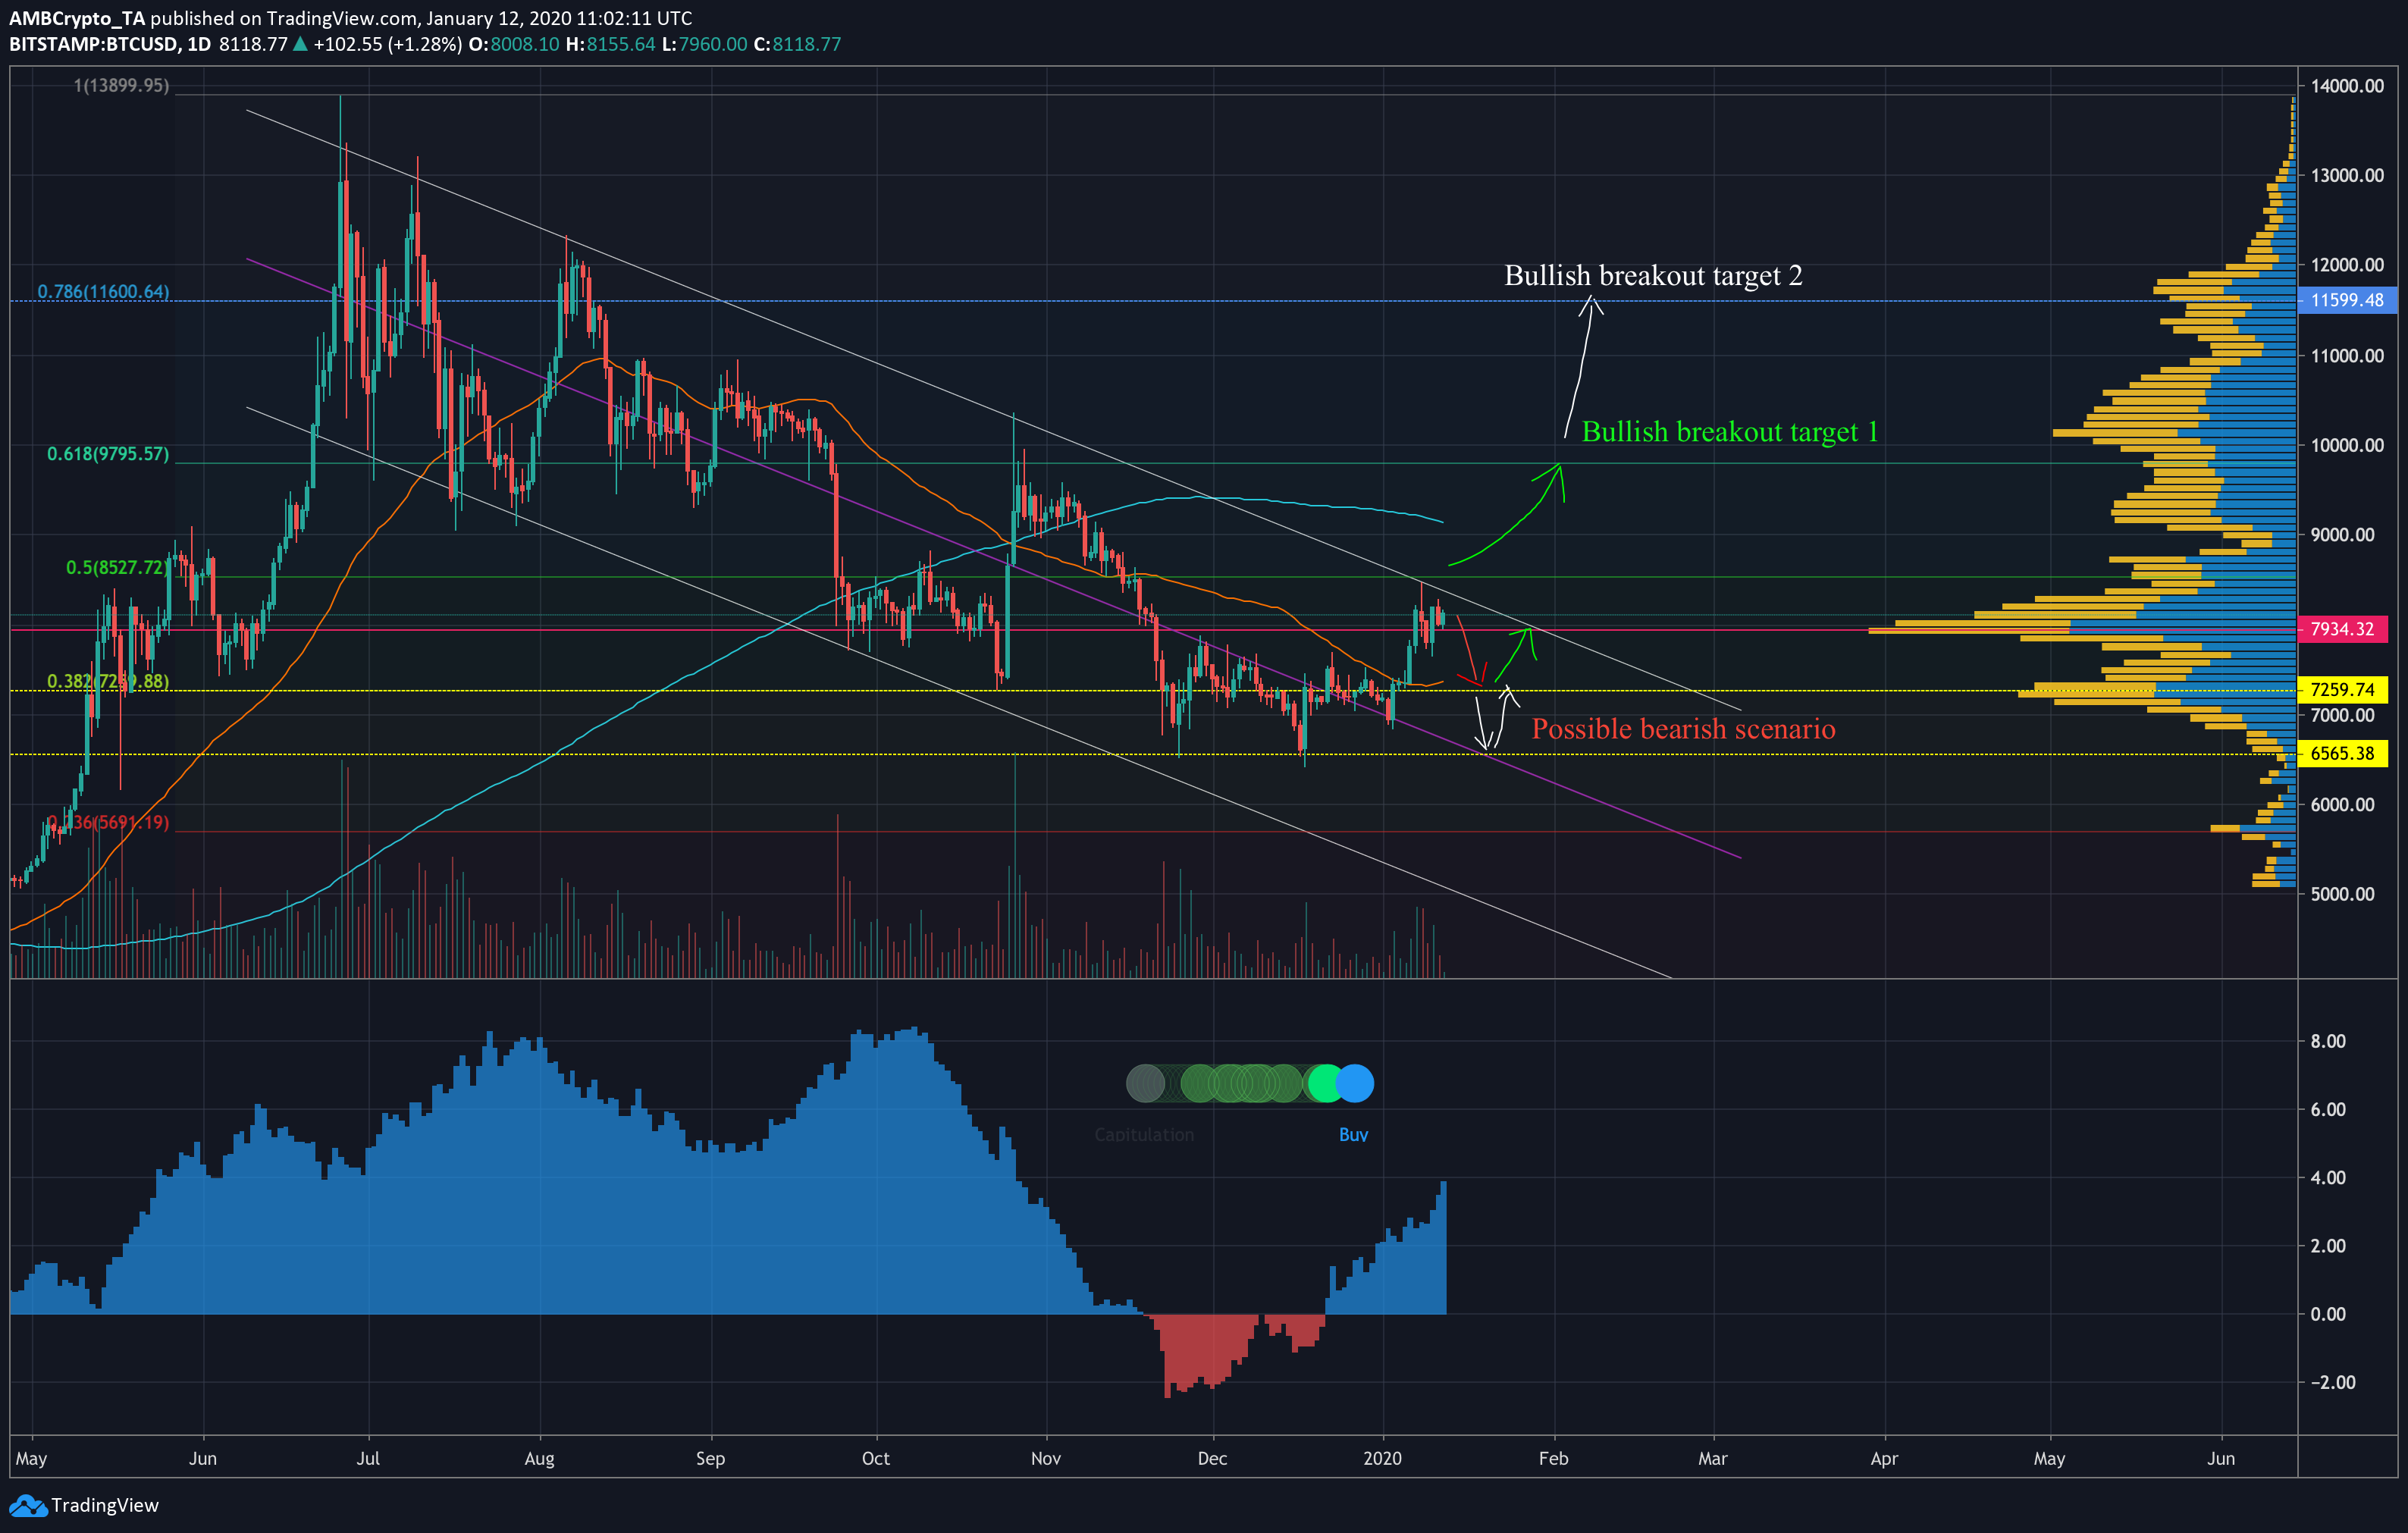
Bitcoin’s daily chart showed BTC in a descending channel formation since June last year, escorted by an overall decreasing volume trend since then. Channels tend to be continuation patterns, making an upward-facing breakout more likely in this scenario.
The 50-day moving average was seen moving under the price candles, supporting the concept of an upward movement in the short to medium-term. The price attempted to break above the 50% Fibonacci retracement line just days ago, and having failed, BTC price maintained its position above $7900.
The 200-day moving average, an indicator of long-term performance, looked bearish, and could be seen towering over the price candles, after having underwent a death cross in late-October.
However, the ‘hash ribbons’ indicator showed a ‘Buy’ signal at the time of writing, which has been in place since late-December. Including this time, the hash ribbons, invented by Charles Edwards of Capriole Investments, have only shown ‘Buy’ signals ten times in the history of Bitcoin. Also, following the indicator has managed to bring in average gains of over 5378%.
According to Edwards, since changes to difficulty can only occur every two weeks, difficulty lags the hashrate. So, the hash ribbons utilize this lag to predict miner capitulation, and potential buy-regions.
Bitcoin Hashrate
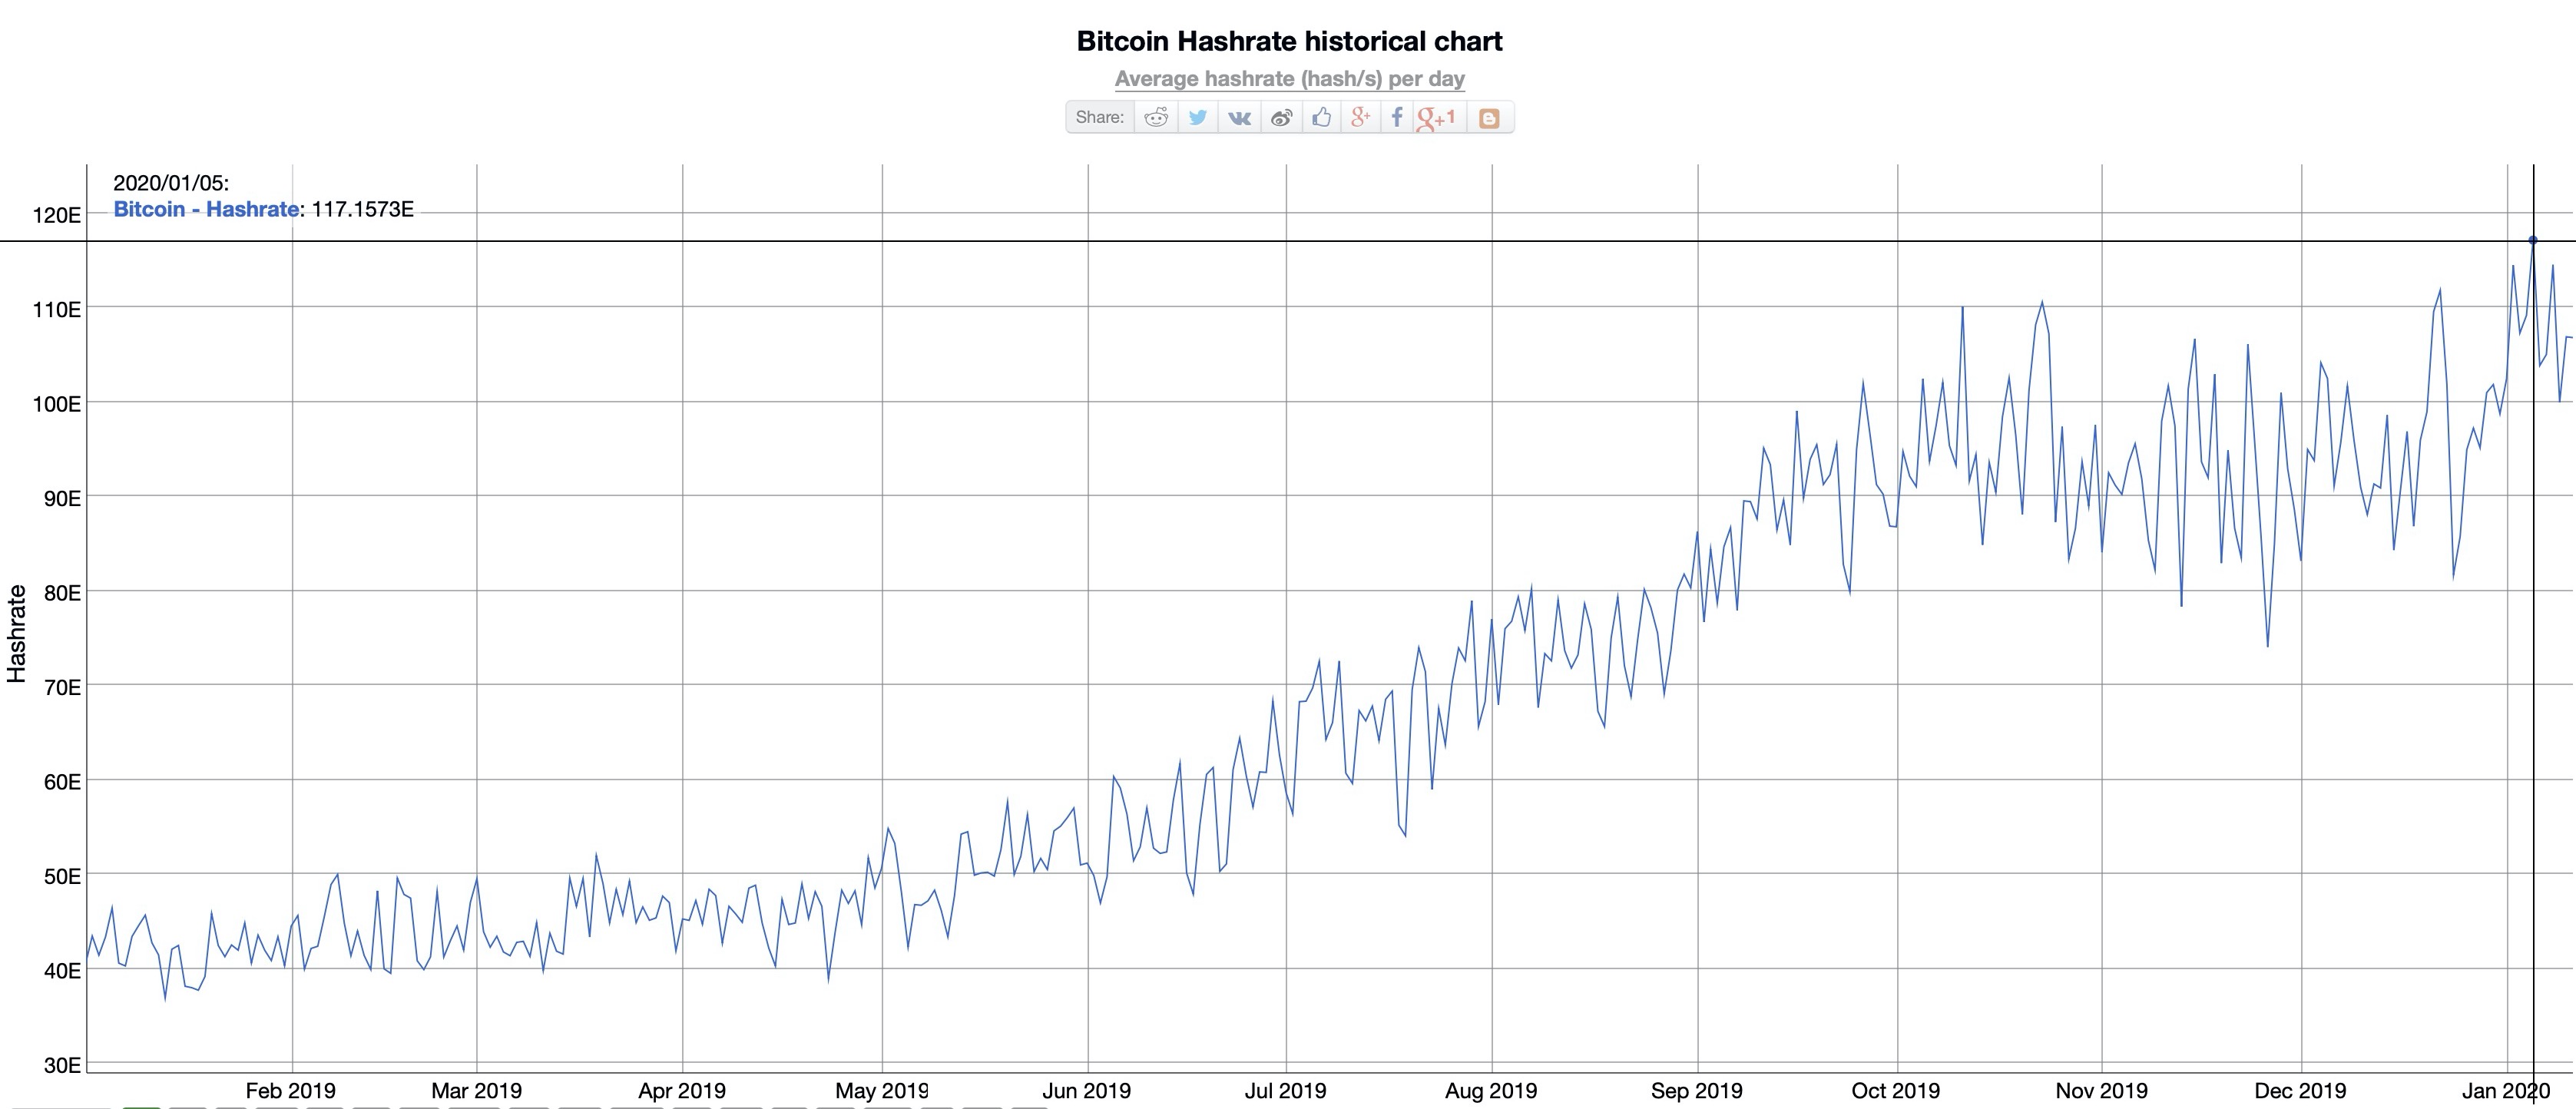
Source: BitInfoCharts
The difficulty was last adjusted on January 1, leaving only a few days till the difficulty recalibrate itself. Since Bitcoin touched a new all-time high hashrate last week, it is likely the difficulty will be adjusted upward in the coming days.
With BTC already moving above the Point of Control, Bitcoin could breakout upward from the pattern boundary, at least to the 61.8% Fibonacci retracement line at $9800, and potentially up to the 78.6% line at $11,600 within the next month.
If the price were to bounce down from the pattern boundary, BTC will likely find support at the 38.2% Fibonacci line, at around $7250, and further support at the channel mid-line. However, it seems unlikely, at this point, that Bitcoin will continue with such a move, and would likely rise back up to test the upper pattern boundary in the near future.
The post appeared first on AMBCrypto


