

Bitcoin looks short-term bearish and long-term bullish due to a familiar technical structure on the chart. Find out more here. | Source: Shutterstock
By CCN Markets: In technical analysis, a support area gets weaker every time the prices touches it. That’s because each tap drains the strength or the demand at the support. A good example of this principle is the bitcoin breakdown of the $6,000 support on Nov. 14, 2018.
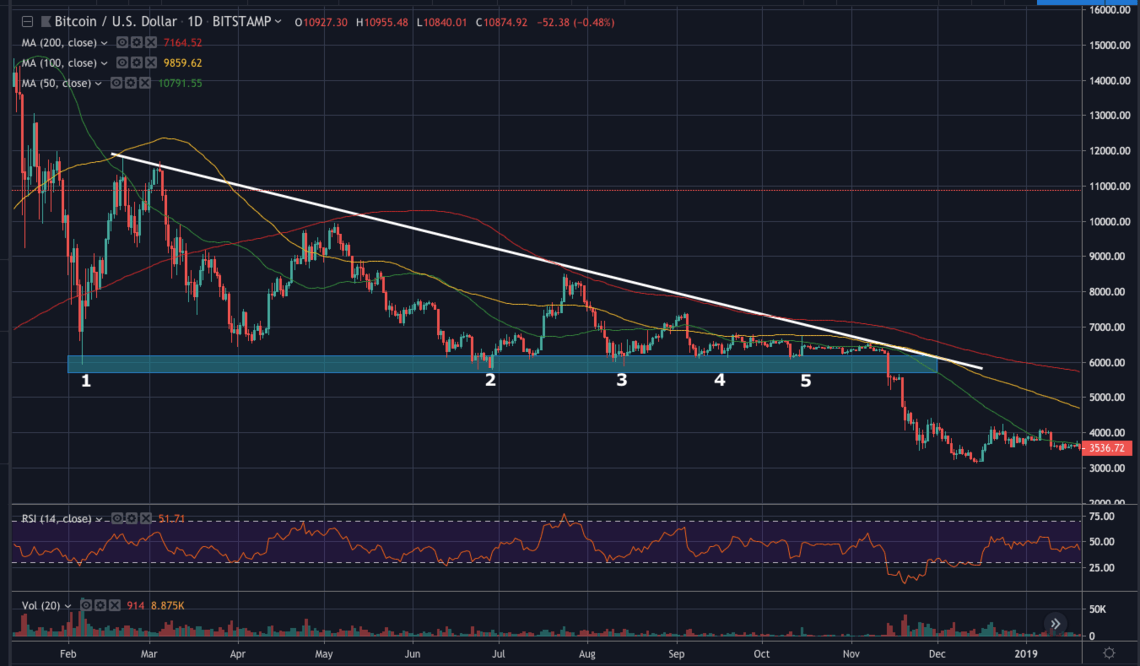
The infamous descending triangle breakdown that sent bitcoin to $3,000 | Source: TradingView
In the chart above, you’ll see that bitcoin bulls fought tooth and nail to keep the support of $6,000 alive. With each tap, the strength of the demand area weakened. This can be seen on the lower highs that were generated after each bounce. As a result, bitcoin formed a long descending triangle.
The support eventually broke on the sixth tap and the rest is history.
Bitcoin Painting a Bearish Pattern Indicating That the Local Top Is In
Nine months after the descending triangle breakdown in November 2018, we’re seeing bitcoin print the same pattern.
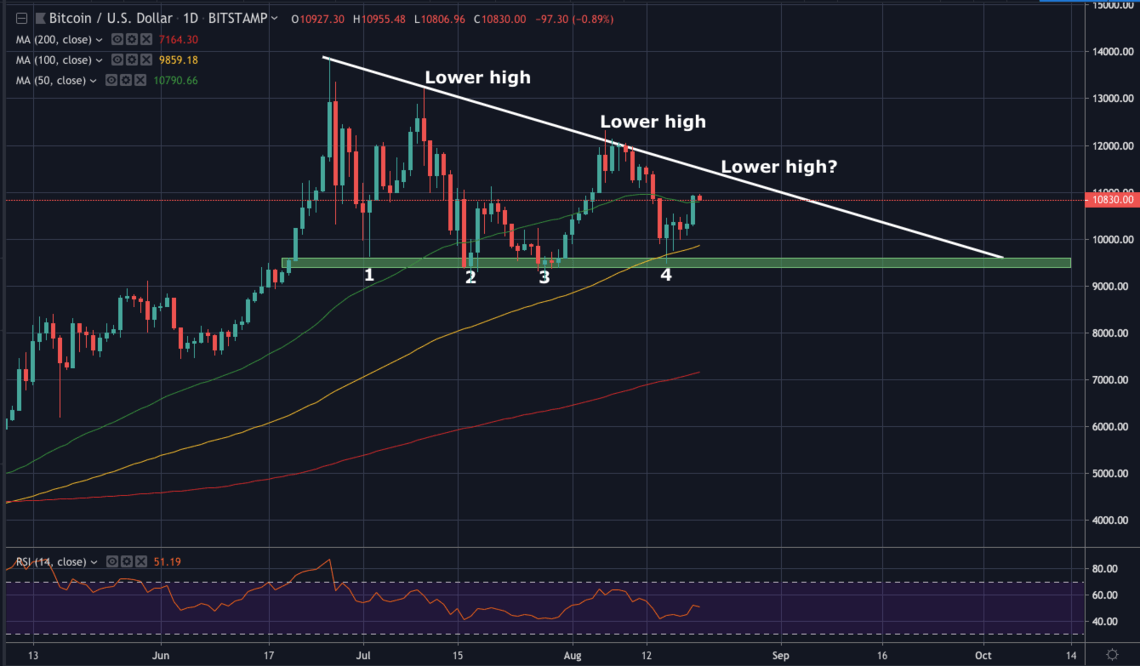
Bitcoin is once again printing a pattern that can snuff out bullish steam | Source: TradingView
It appears that bitcoin has tapped support between $9,400 – $9,600 four times already. In the process, we’re seeing multiple lower highs en route to another descending triangle.
Trader and Elliottician BenjaminBlunts has also seen the same patterns. In a tweet, he wrote,
“If the upper triangle TL (trendline) has a steep decline and the lower TL relatively flat, we are most likely in a [bearish] triangle.”
when your, tracking triangles the angle of the decline matters.
if the upper triangle TL has a steep decline and the lower TL relatively flat, we are most likely in a ? triangle
the opposite is true for ? triangles, steep lower TL and flat upper TL indicates bulls are winning pic.twitter.com/VM7MlJJATF
— ??BenjaminBlunts?? (@SmartContracter) August 20, 2019
Based on the trader’s chart, the target for the bounce appears to be around $7,000. This is close to our bottom picking price target of $7,400.
The Breakdown Is a Buy on Dips
While we are short-term bearish on the leading cryptocurrency, we believe that long-term investors might want to see any move below the support as a buying opportunity. We see the impending pullback as a setup for a big comeback. After all, bitcoin’s uptrend remains strong.
In a conversation with Cole Walton today, Head Trader at Kanos Capital Management and Co-Founder of Plouton Mining, he echoed our long-term bullish stance:
“Any break under [$10,000] will most likely see very heavy buying and not last long. We should see the price work it’s way toward $100,000 as we move toward the next reduction in the block reward for miners in May of 2020.”
Thus, it may be a solid investment strategy to buy the expected dip and hold until the May 2020 halving.
Disclaimer: This article is intended for informational purposes only and should not be taken as investment advice.
This article is protected by copyright laws and is owned by CCN Markets.
The post appeared first on CCN


