
Just a quick weekend recap: Following our most recent BTC price analysis from Friday, where we had stated that the correction is likely to test lower levels, we can see Bitcoin breaking below $10,000 after failing to break above the crucial resistance at $10,500.
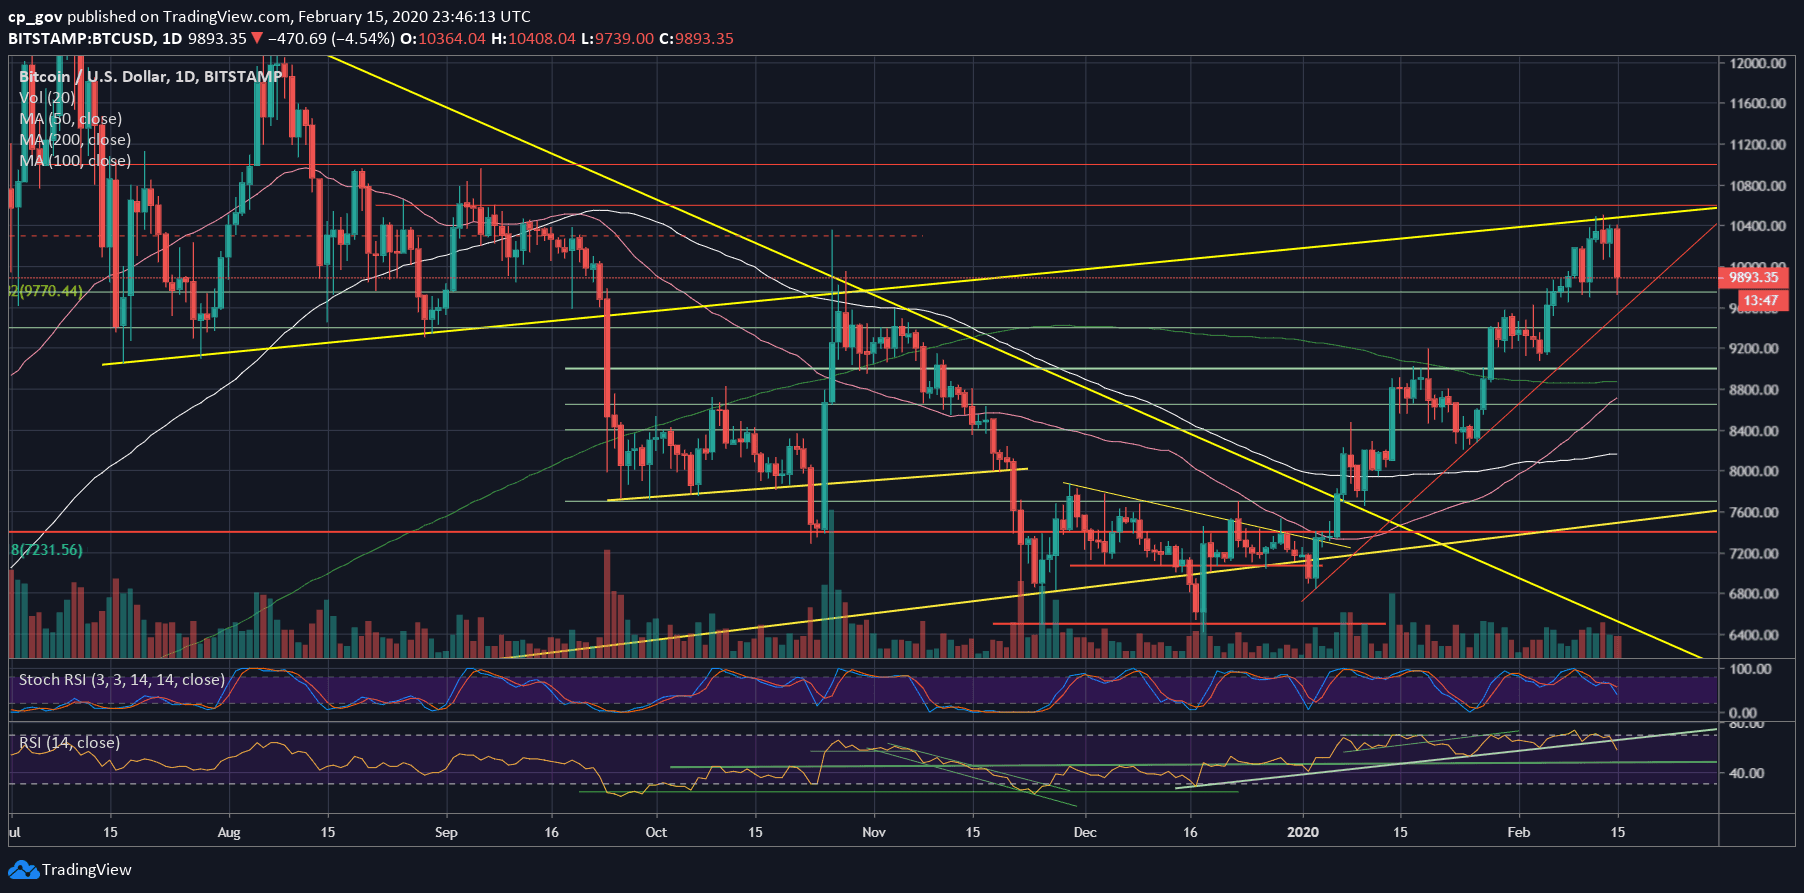
As can be seen on the following daily chart, after getting rejected by the long-term ascending trend-line (started forming on July 2019), Bitcoin broke down the significant 38.2% Fib level at $10,200, along with the marked 4-hour trend-line, and continued dropping further down.
As of writing these lines, Saturday’s daily high was over $10,400 (Bitstamp), while the current daily low lies at $9730: an intraday drop of almost $700. Shortly after hitting the daily low, Bitcoin had recovered a bit, and currently trading around $9900.
What is very surprising, and likely a positive longer-term sign, is the fact that the altcoins are standing still and not losing their value against Bitcoin, despite the sharp correction of BTC.
Another positive sign is the CME Futures’ positive price gap, at $10,425. Gaps are not always get filled; however, Bitcoin had taught us that most of them are getting filled, and even very quickly.
Total Market Cap: $292 billion
Bitcoin Market Cap: $180.7 billion
BTC Dominance Index: 61.8%
*Data by CoinGecko
Key Levels To Watch & Next Possible Targets
– Support/Resistance levels: As mentioned above, Bitcoin is trading just below the $10,000 resistance mark. In case of a break-up, then the next possible target is the $10,200 support turned resistance level. The next major level is $10,400 before the 2020 high at $10,500, along with the above mentioned long-term ascending trend-line on the daily chart.
From below, the first significant area of support is around the $9750 level. This includes a robust horizontal support area which was kept since February 5. Besides, the Golden Fib level of the 2017 bull-run lies at $9770.
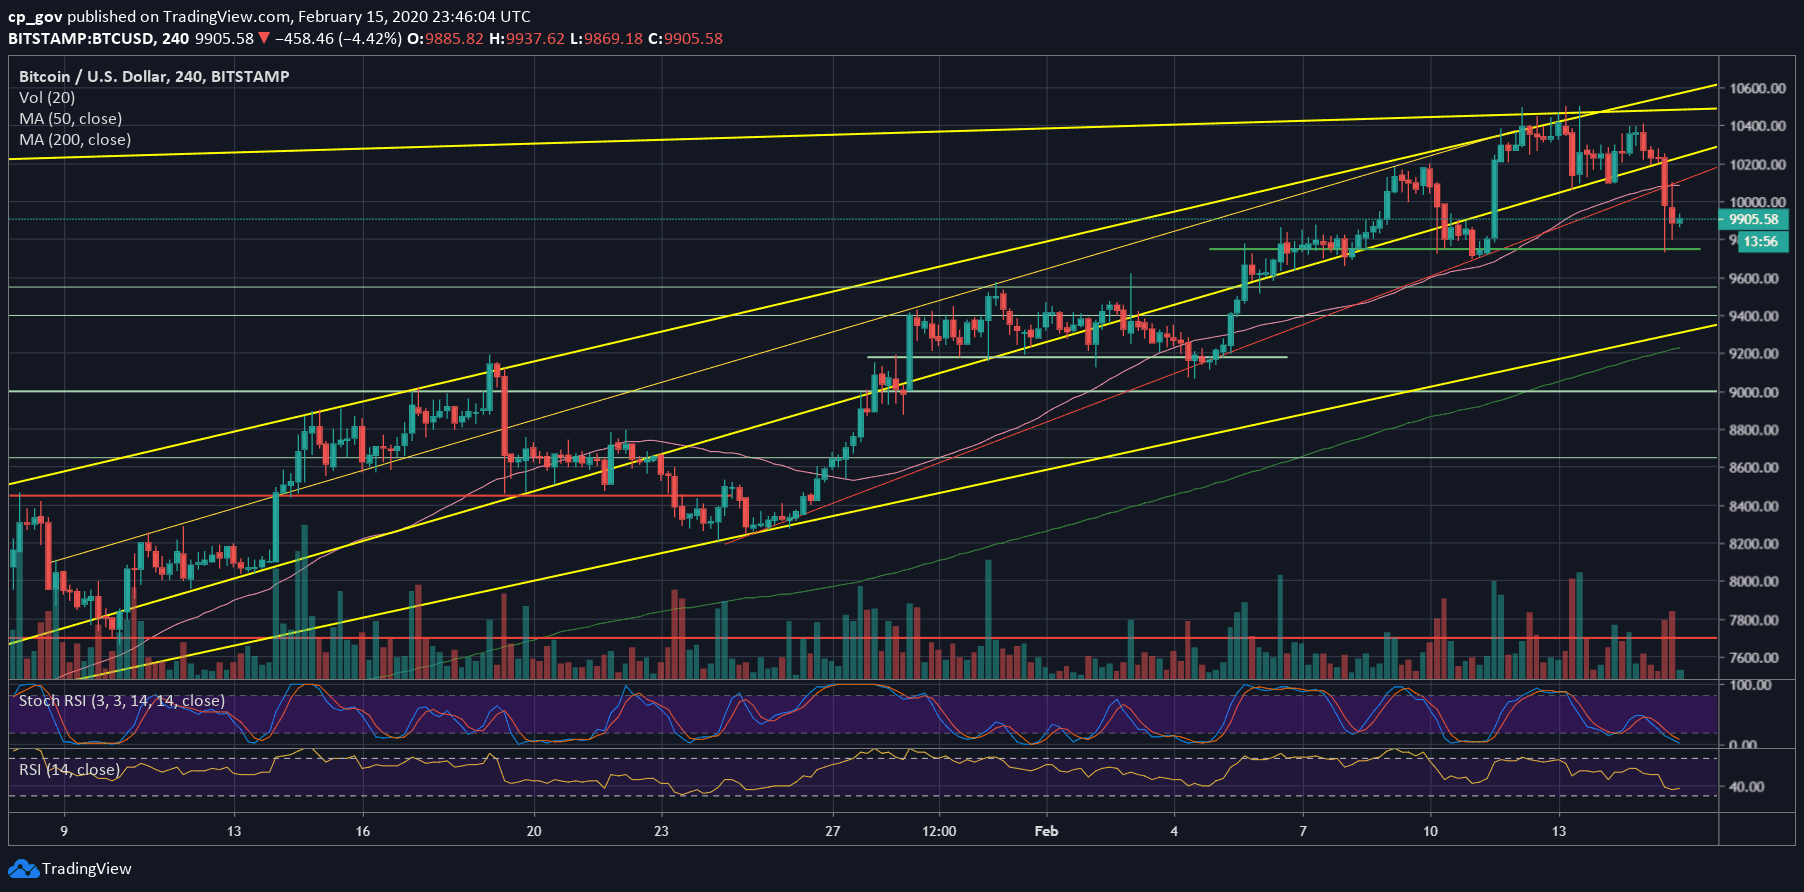
In case Bitcoin does break down the latter, the next support lies around $9550, before the significant $9400 support, along with a mid-term ascending trend-line shown on the 4-hour chart. Further below lies $9170 and $9000.
– The RSI Indicator: We had mentioned here the bearish price divergence more than once over the past week.
The significant ascending trend-line of the daily RSI had been broken down. This higher-lows line was started forming in the middle of December (almost two months, when Bitcoin touched $6410 – its lowest level since May 2019).
The RSI might find support here (around 60); however, it seems that there is some more room to go down.
– Trading volume: Today’s volume was the highest of the past week. Even though is was during the weekend. Not a positive sign for the bulls.
BTC/USD BitStamp 4-Hour Chart
BTC/USD BitStamp 1-Day Chart
Disclaimer: Information found on CryptoPotato is those of writers quoted. It does not represent the opinions of CryptoPotato on whether to buy, sell, or hold any investments. You are advised to conduct your own research before making any investment decisions. Use provided information at your own risk. See Disclaimer for more information.
The post appeared first on CryptoPotato


