
Good things don’t come up so quickly. This is what happened with Bitcoin, following the first time in four months that the coin had crossed the $10,000 mark.
Two days ago, following the 10K break, we saw it rising a bit more but getting rejected before the next critical resistance price level at $10,300 – $10,400.
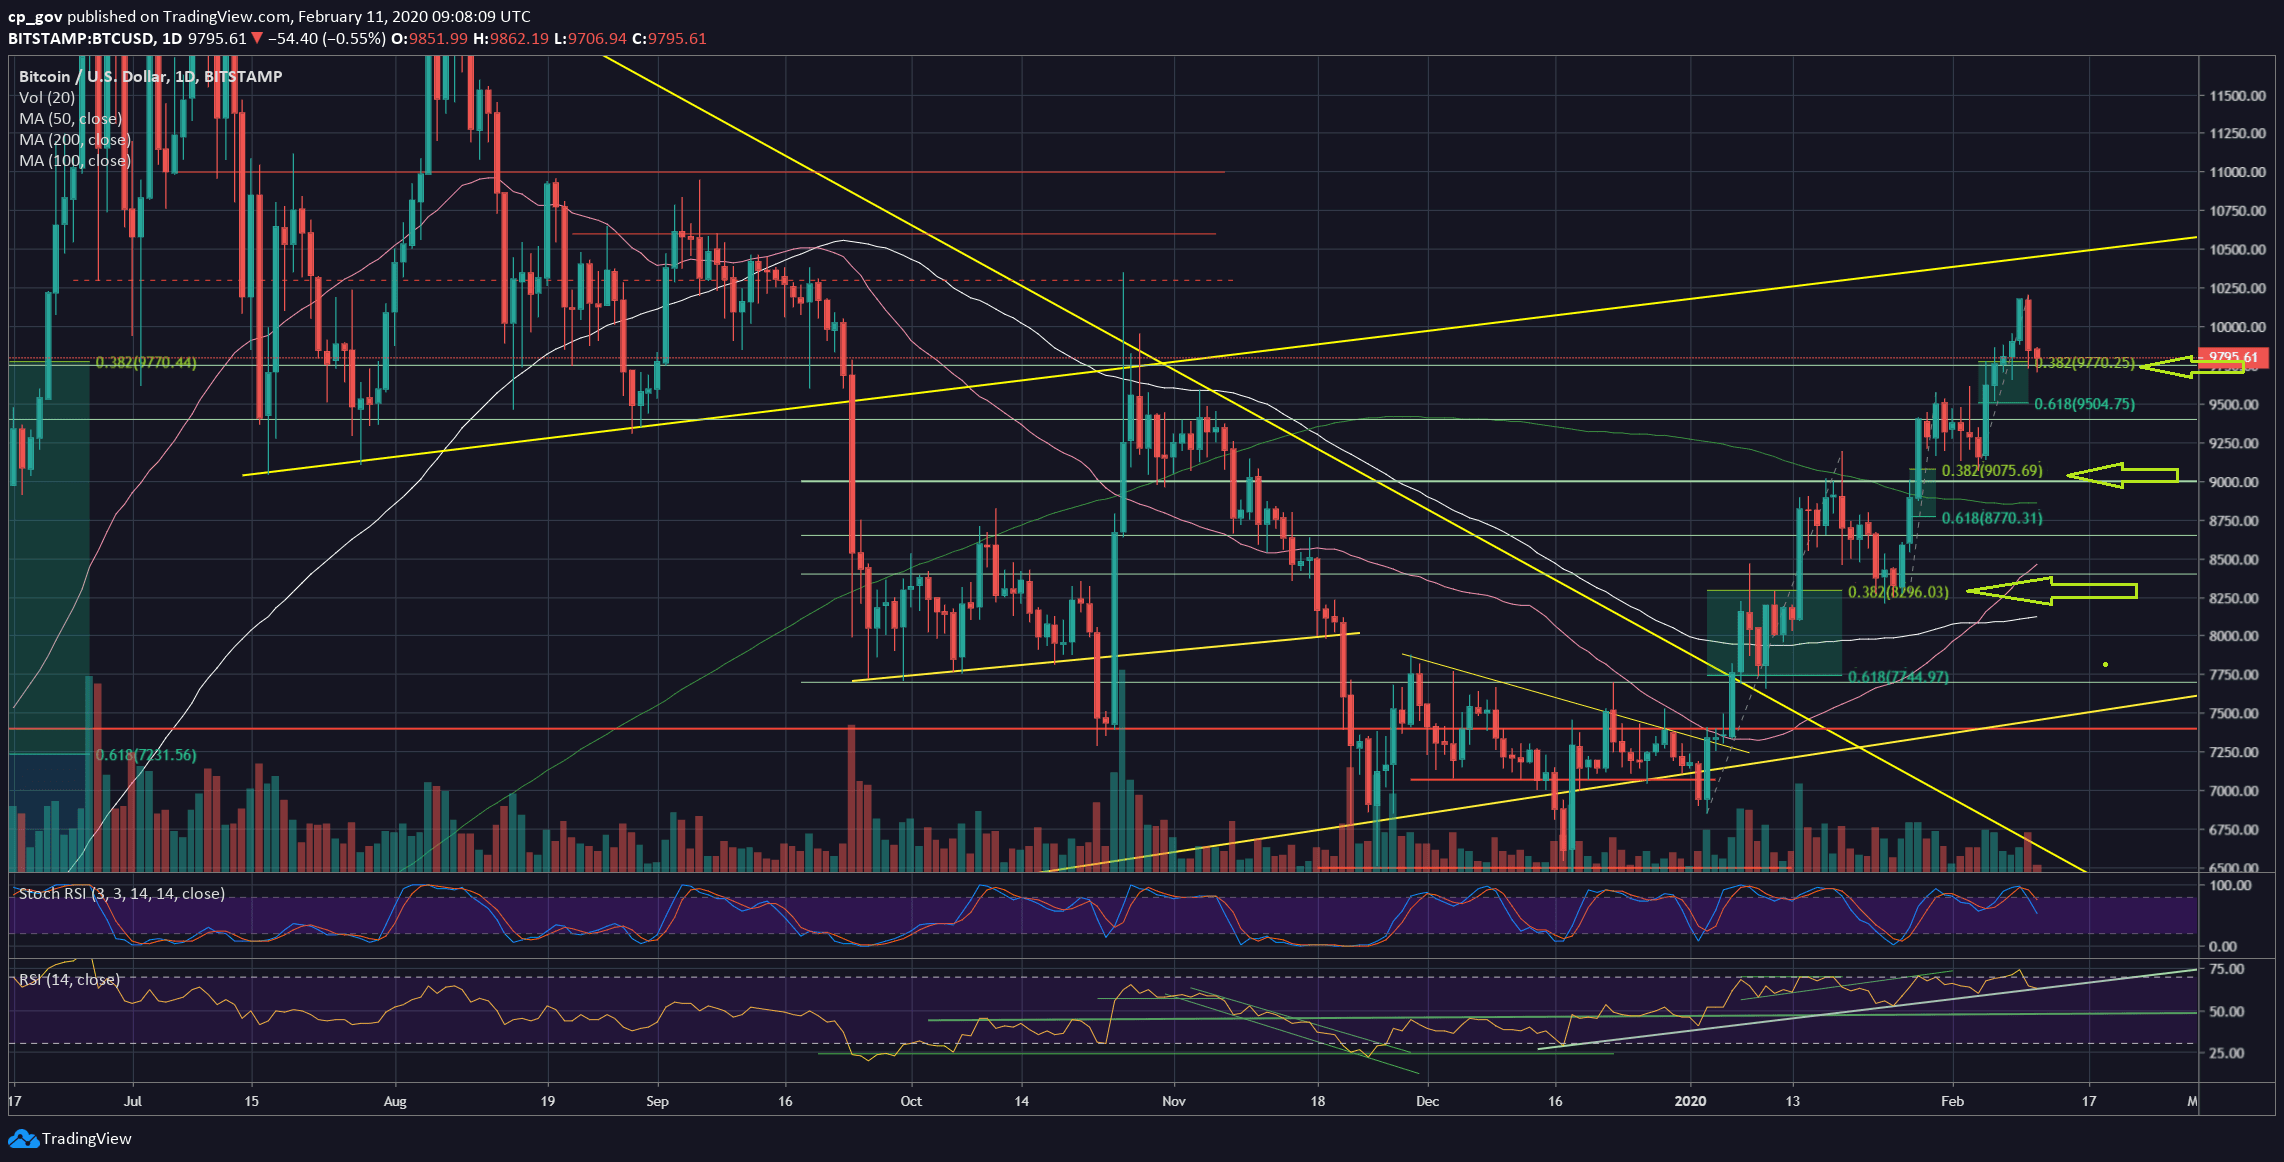
The positive is that everything is healthy so far. Looking at the following daily chart since the beginning of 2020, you can see three mini-rallies (including the most recent one from Sunday, all marked by green arrows), where Bitcoin had corrected back to the 38.2% Fib retracement level.
As of writing these lines, Bitcoin is testing the $9750 horizontal support, and guess what? This is accurately where the 38.2% Fib level of the most recent surge is at.
Besides, it’s not a surprise that the momentum indicator, the RSI, is also testing the mid-term trend-line at the same time – which, so far, is a decent higher-highs trend-line.
Total Market Cap: $281 billion
Bitcoin Market Cap: $178 billion
BTC Dominance Index: 63.3%
*Data by CoinGecko
Key Levels To Watch & Next Possible Targets
– Support/Resistance levels: As mentioned above, if Bitcoin finds support around the current price levels (38.2% Fib retracement), then this can easily become the ground for a new 2020 all-time high very soon.
In case this level, together with the RSI, breaks down, then the next possible support might be $9500, which is the Golden Fib of 61.8% correction. Further below lies the $9400 support.
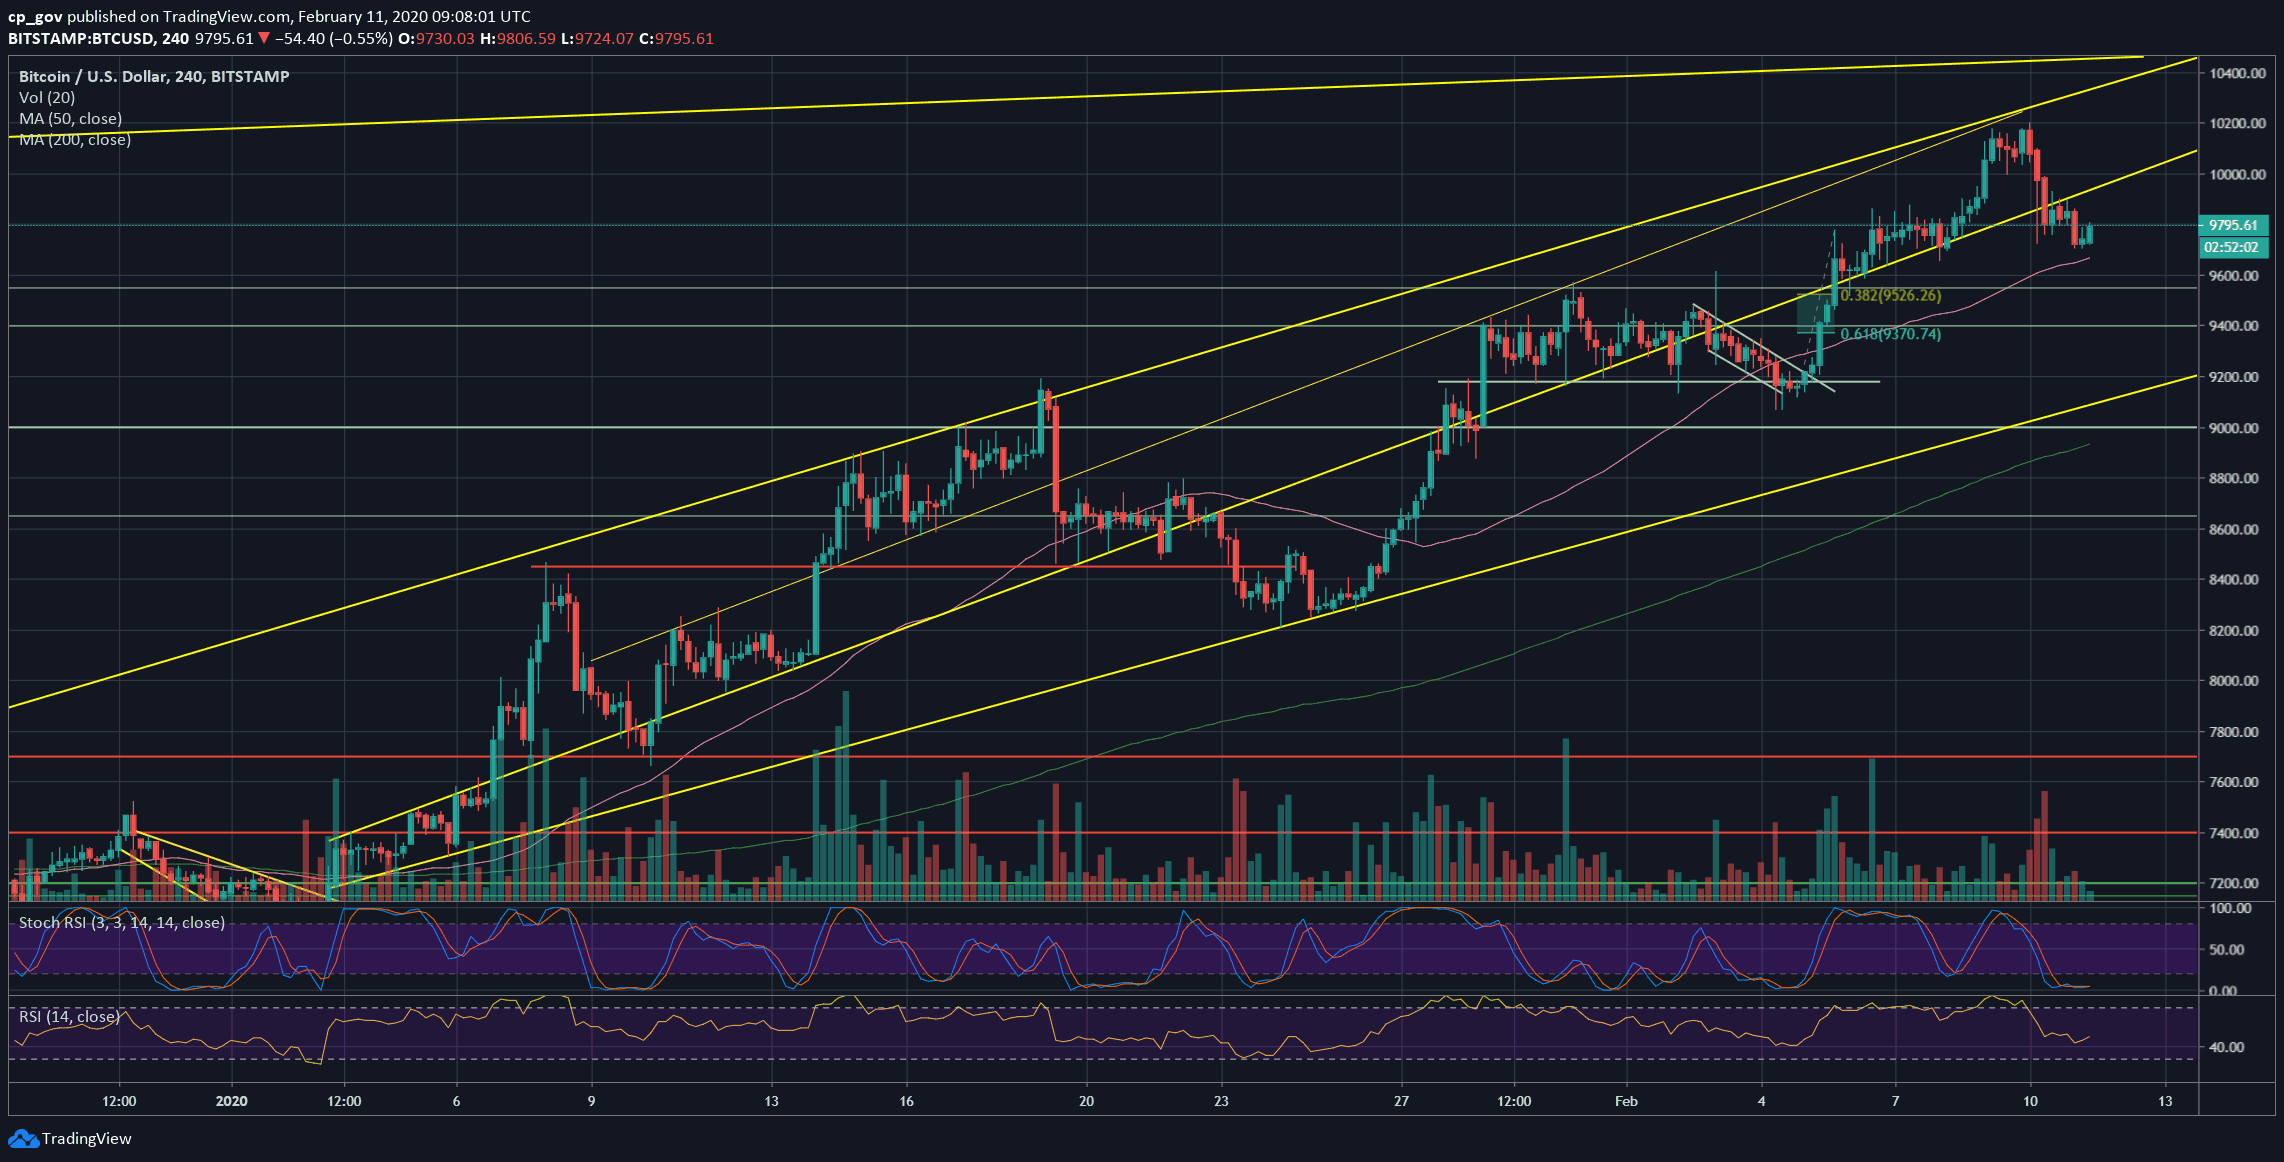
From above, after getting rejected, the first level of resistance is now around $9900, along with the middle-marked ascending trend-line on the 4-hour chart. As we can see on the following chart, Bitcoin broke down that line, and then confirmed it as new resistance by touching it and getting rejected at $9900.
The next significant resistance is the $10,200 area, which is the 2020 high that was reached during Sunday.
Further above lies $10,300 – $10,400. This old resistance contains the high that was reached during the “Chinese pump” on October 26 ($10,350), along with past horizontal resistance and the long-term ascending line as can be seen on both the following charts- 4-hour and daily.
– The RSI Indicator: Discussed above.
We can also mention here that the Stochastic RSI oscillator is under correction and points down (support the idea that there is more room to go down).
– Trading volume: We can see that yesterday’s drop carried a higher volume candle than Sunday’s candle following the price surge to $10,200. This might be a little bit tricky and not a positive sign for the bulls. However, both trading days’ volume candles aren’t very significant, and Sunday’s volume can be explained because of the weekend.
BTC/USD BitStamp 4-Hour Chart
BTC/USD BitStamp 1-Day Chart
Disclaimer: Information found on CryptoPotato is those of writers quoted. It does not represent the opinions of CryptoPotato on whether to buy, sell, or hold any investments. You are advised to conduct your own research before making any investment decisions. Use provided information at your own risk. See Disclaimer for more information.
The post appeared first on CryptoPotato


