
Our previous price analysis had identified a tight range in which Bitcoin is trading inside. Over the past hours, this range is seemingly cracking down, to the downside.
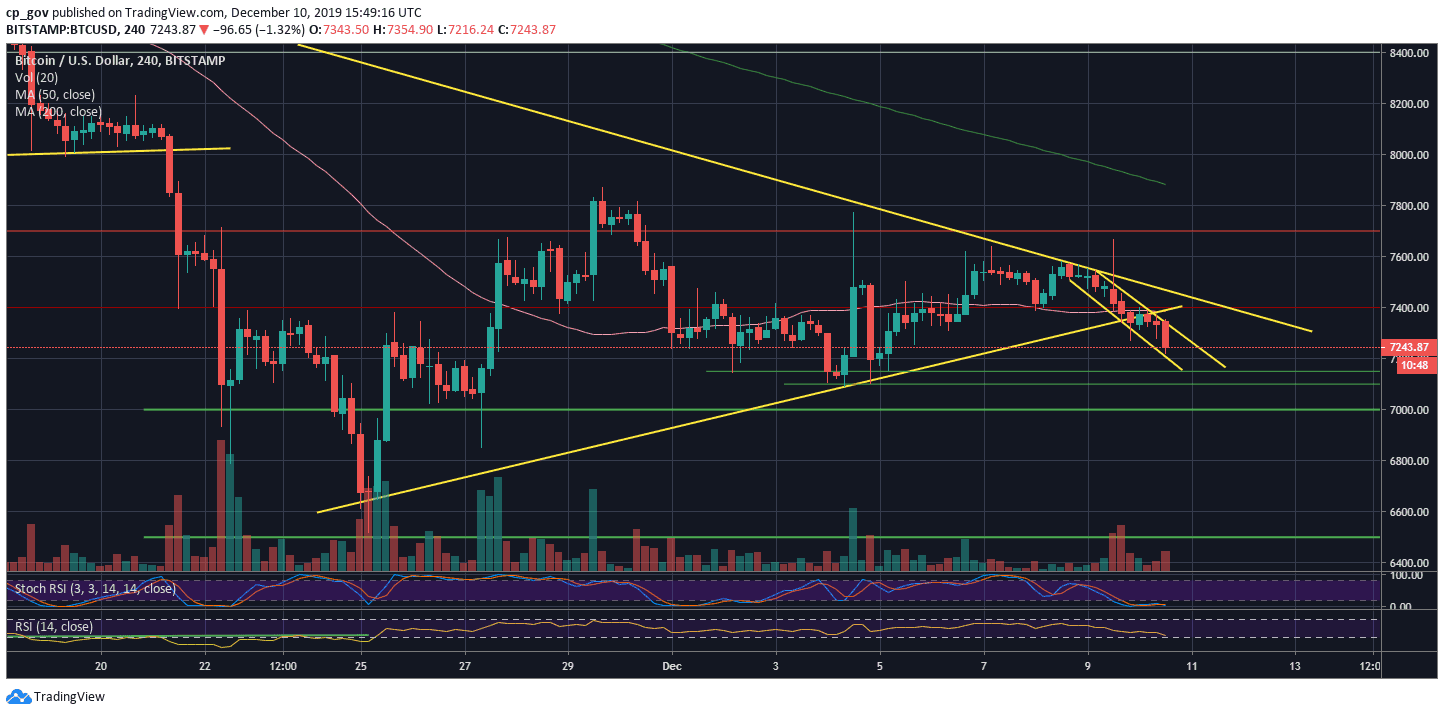
For the past five days, Bitcoin was trading between $7300 to $7600. Despite a fake-out that reached the mentioned resistance area of $7700, Bitcoin was trading inside a descending channel, which can be seen on the following 4-hour chart.
Adding negative indication coming on behalf of the Relative Strength Index (the RSI), as of now, it looks like Bitcoin would like to retest the $7000 area once again.
Total Market Cap: $198 billion
Bitcoin Market Cap: $132.3 billion
BTC Dominance Index: 66.8%
*Data by CoinGecko
Key Levels to Watch
– Support/Resistance: As of writing this, Bitcoin had recently marked $7250 as the current daily low. Further below lies $7150 support (weak), $7100, and $7000 support. The last includes a critical ascending trend-line (marked on the daily chart), which started forming since April 2019.
Further down is the $6800 horizontal support, before the $6500 area, which is Bitcoin’s 6-month low.
In the case of a correction, the first resistance is the 4-hour marked descending channel. A little above lies the $7400 resistance, along with the mid-term descending trend-line. Further above lies the $7700 – $7800 horizontal resistance.
– The RSI Indicator: In our previous analysis, we had identified the 45 RSI level as a crucial resistance. Unfortunate to the Bulls, Bitcoin failed in breaching it, and over the past two days, the RSI is declining and losing momentum, in correlation with the price.
– Trading volume: Following low-volume days, Bitcoin finally has seen some price action. However, this is far from reaching near the top volume days of the past month.
BTC/USD BitStamp 4-Hour Chart
BTC/USD BitStamp 1-Day Chart

Disclaimer: Information found on CryptoPotato is those of writers quoted. It does not represent the opinions of CryptoPotato on whether to buy, sell, or hold any investments. You are advised to conduct your own research before making any investment decisions. Use provided information at your own risk. See Disclaimer for more information.
Cryptocurrency charts by TradingView.
Technical analysis tools by Coinigy.
You might also like:
The post appeared first on CryptoPotato


