
This is going to be a quick update following our latest Bitcoin price analysis from yesterday.
As mentioned yesterday, since the year of 2020 begun, Bitcoin price had gone through three mini-rallies. All those rallies corrected back to the Fibonacci retracement level of 38.2% (a clear sign of bullish uptrend).
The last of the three rallies ended yesterday, while Bitcoin corrected to $9,750 (which is the 38.2% Fib level).
We stated in our analysis that in the case Bitcoin maintains that level – the higher-highs trajectory is kept alive and more than that, this way of rising is a lot healthier than the rapid parabolic way.
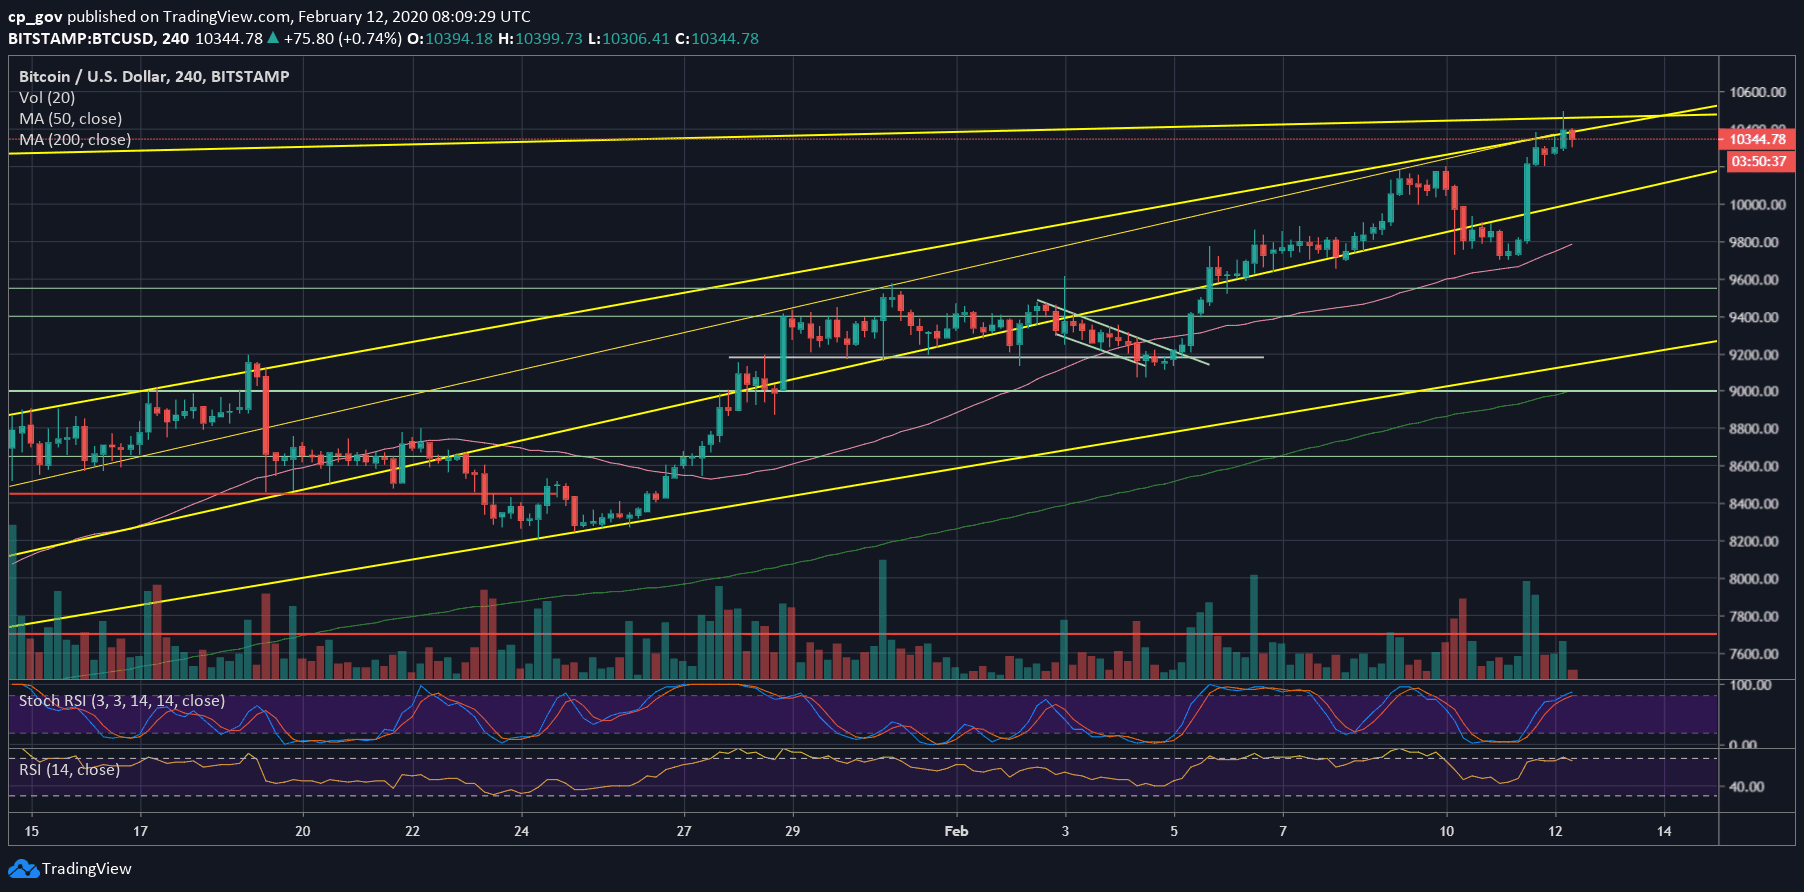
Long story short, Bitcoin maintained the 38.2% Fib level once again, followed by a huge price rally to $10,400, then retracement back to the prior resistance turned support level at $10,200. Following a few hours of consolidation, we currently witness Bitcoin breaking to a new 2020 high and surpassing the prior $10,350 high that was reached during the October 26 “Chinese Pump.”
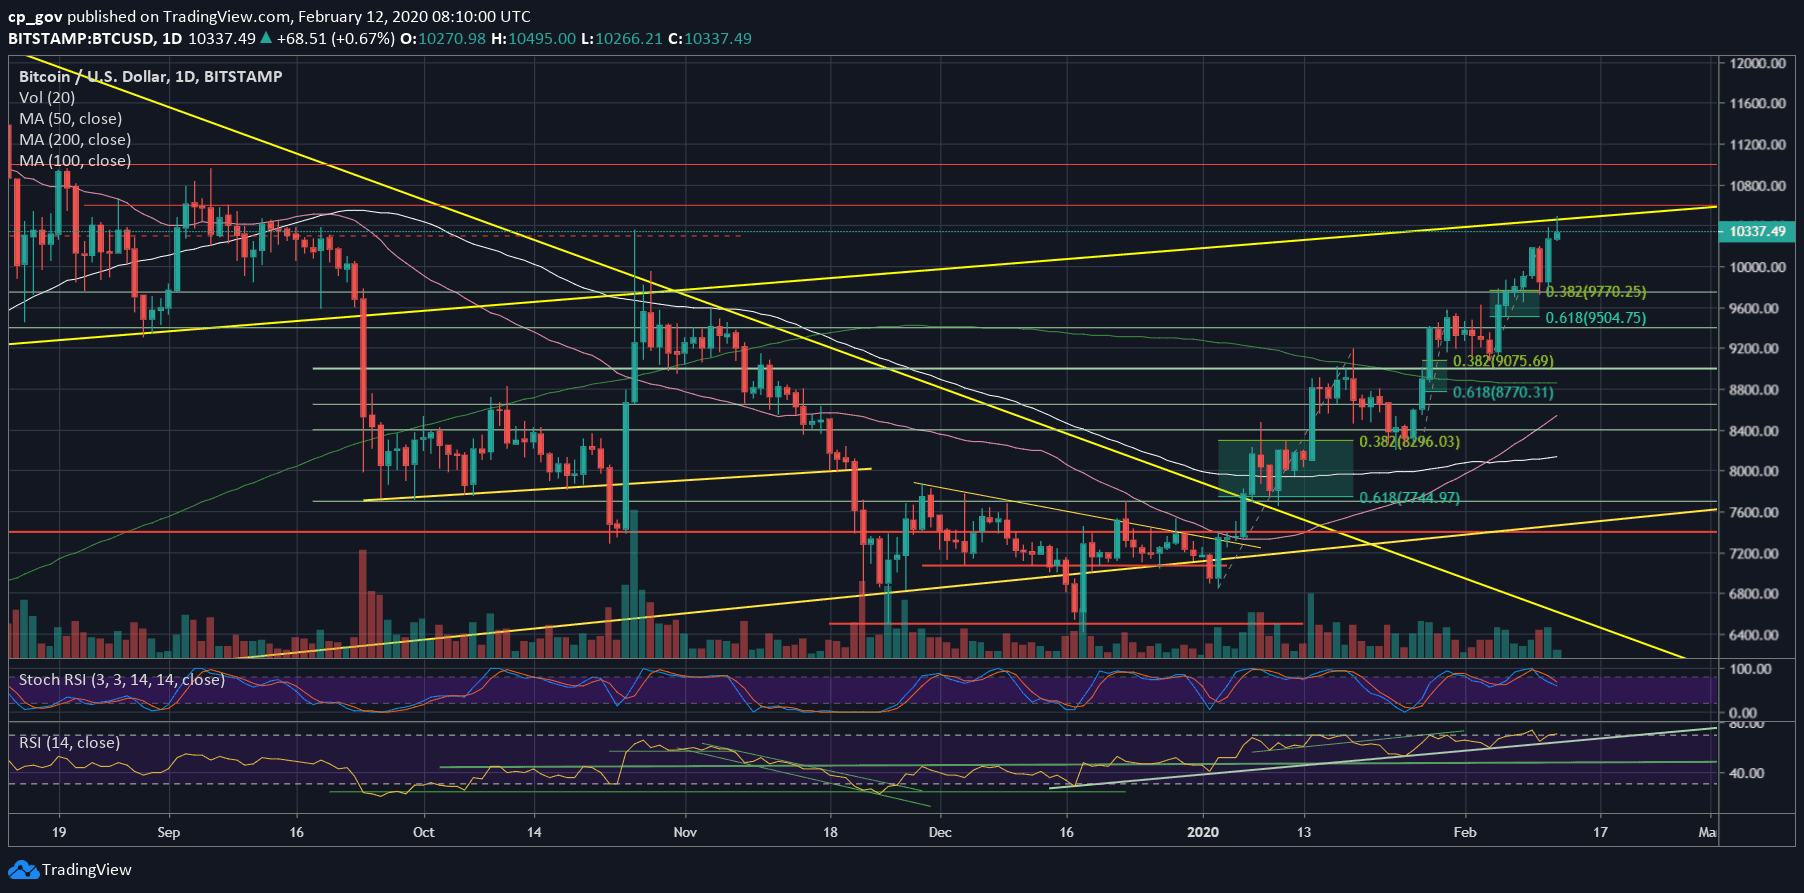
As of writing these lines, Bitcoin marks $10,500 as its new 2020 high, which is also the highest level since September 2019. However, as can be seen on the following daily chart, this is precisely where a significant long-term ascending trend-line lies.
Total Market Cap: $302 billion
Bitcoin Market Cap: $189 billion
BTC Dominance Index: 62.6%
*Data by CoinGecko
Key Levels To Watch & Next Possible Targets
– Support/Resistance levels: Bitcoin is currently trading inside the confluence price zone of $10,300 – $10,400. This, together with close by resistance at $10,500 (the current 2020 high) could slow Bitcoin down a bit.
In case of a correction, the first level of support would be the current price level, followed by $10,200. Further below lies the $10,000 benchmark. Further below lies $9700 – $9800, which is the low from yesterday.
In case Bitcoin breaks $10,500, we can expect the rally to get out of control quickly. The next resistance would be $10,600, followed by $11,000 and $11,200.
– The RSI Indicator: After finding support on the mid-term ascending RSI trend-line, the significant momentum indicator is showing a little bit of bearish price divergence on the daily. This might signal on a correction coming up, but not necessarily. We will keep our eyes on the indicator
– Trading volume: The bulls are strong here as well. Yesterday reversal volume surpassed Monday’s volume candle. Euphoria in the markets.
BTC/USD BitStamp 4-Hour Chart
BTC/USD BitStamp 1-Day Chart
Disclaimer: Information found on CryptoPotato is those of writers quoted. It does not represent the opinions of CryptoPotato on whether to buy, sell, or hold any investments. You are advised to conduct your own research before making any investment decisions. Use provided information at your own risk. See Disclaimer for more information.
The post appeared first on CryptoPotato


