
A quick update following yesterday’s analysis. As we mentioned here yesterday on the previous analysis – Bitcoin price’s recent correction down to $8200 was healthy (so far).
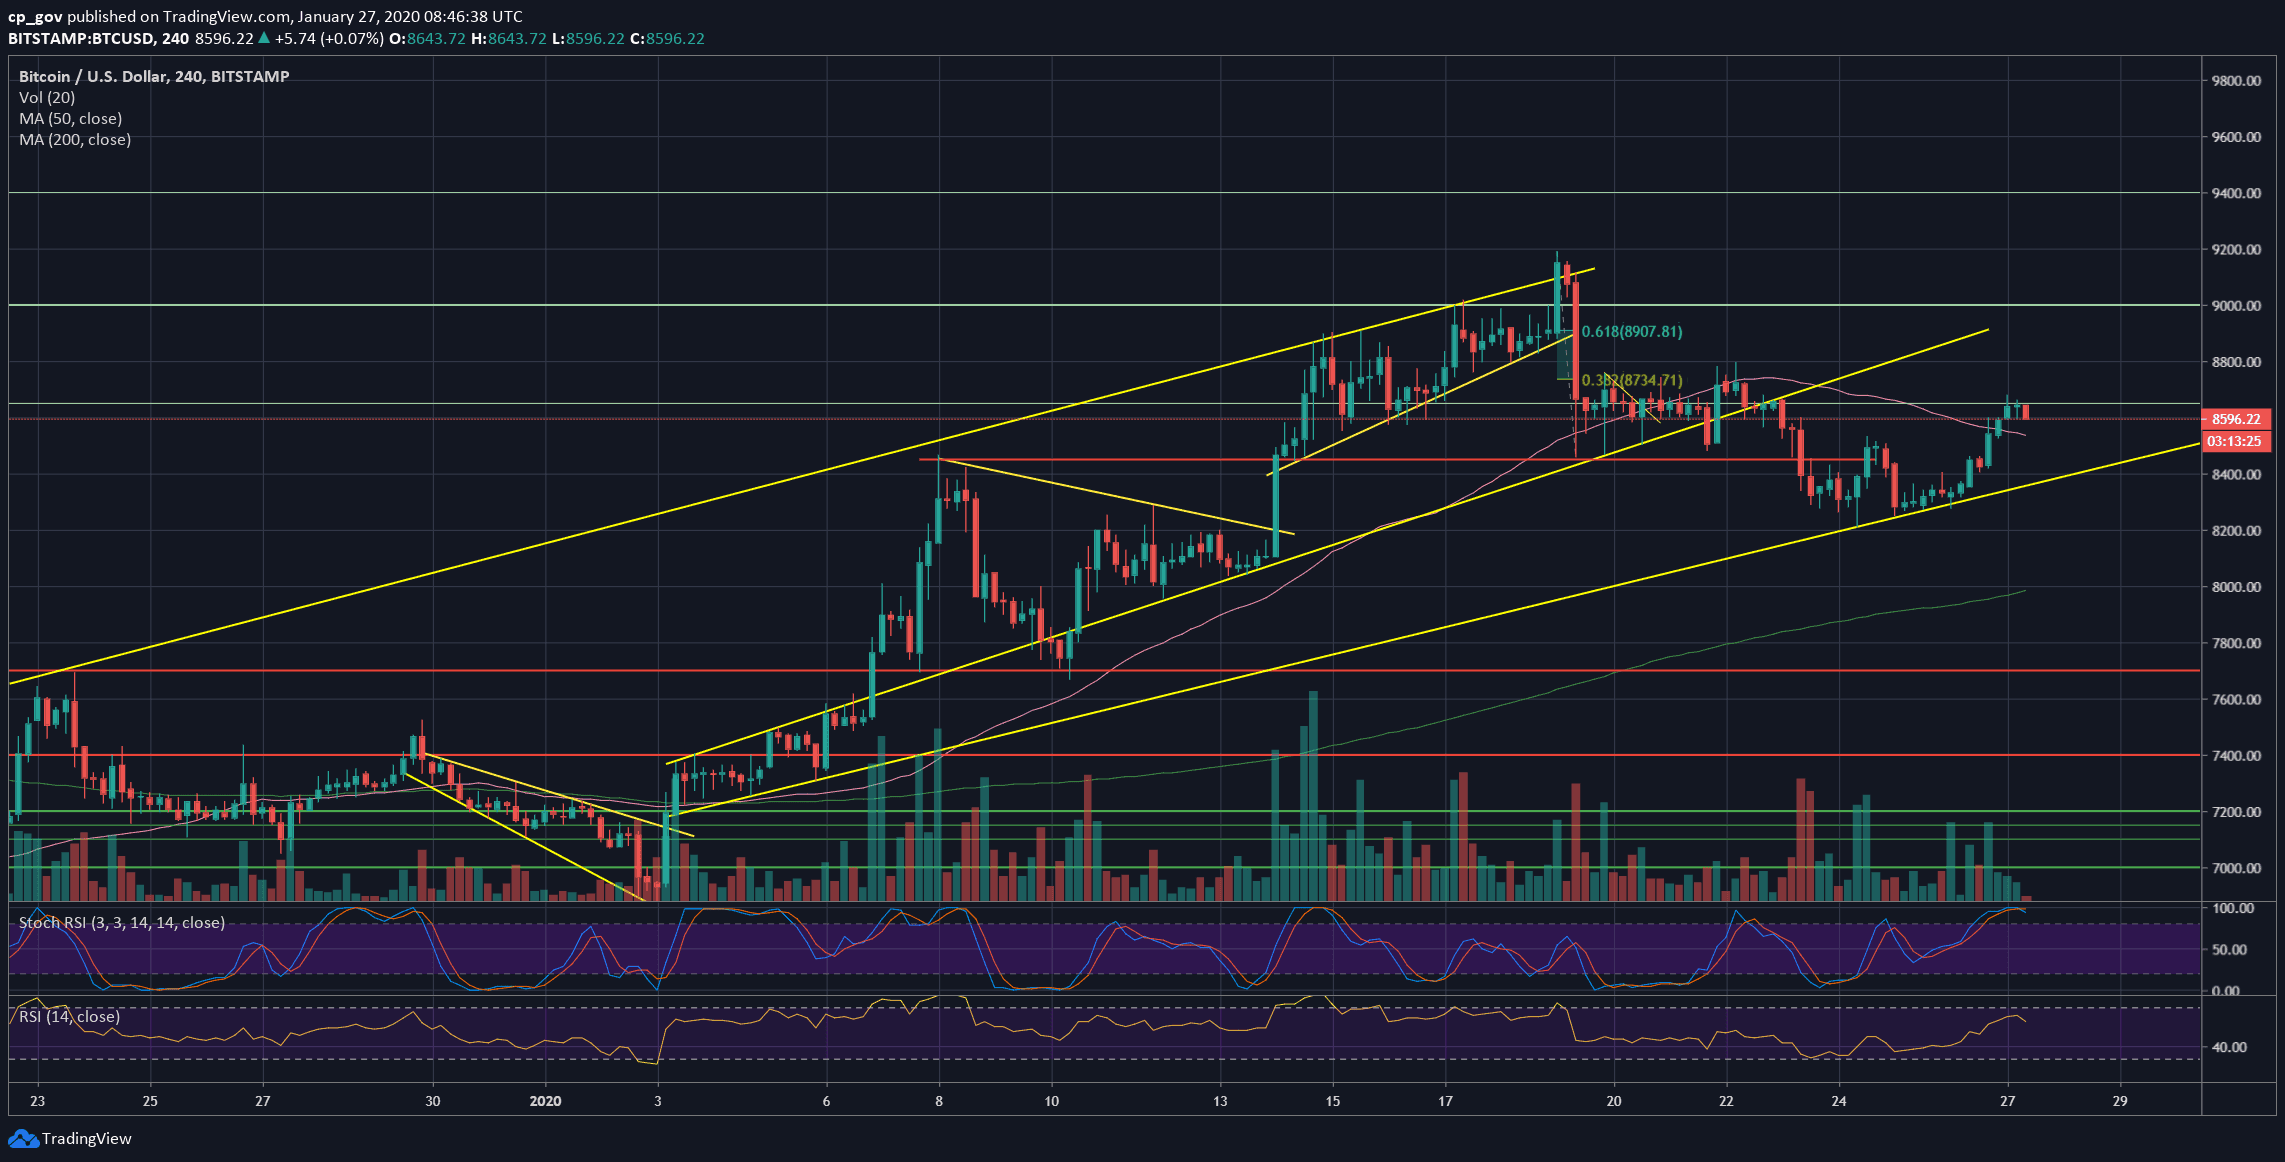
Added to the above, is the fact that Bitcoin had found support precisely on the lower trend-line of the ascending channel, marked on the following 4-hour’s chart.
Over the past 24 hours, we had seen Bitcoin gaining momentum to break above the mentioned $8400 – $8450 resistance, and quickly surging back to the $8600 support turned resistance price area.
As of writing these lines, Bitcoin is trading for hours around the critical resistance area. A break here and Bitcoin is likely to jump to the next target level of $8800 – $8900 which contains the significant 200-days moving average line (~$8915 as of writing these lines).
Total Market Cap: $238.9 billion
Bitcoin Market Cap: $157.1 billion
BTC Dominance Index: 65.8%
*Data by CoinGecko
Key Levels To Watch & Next Targets
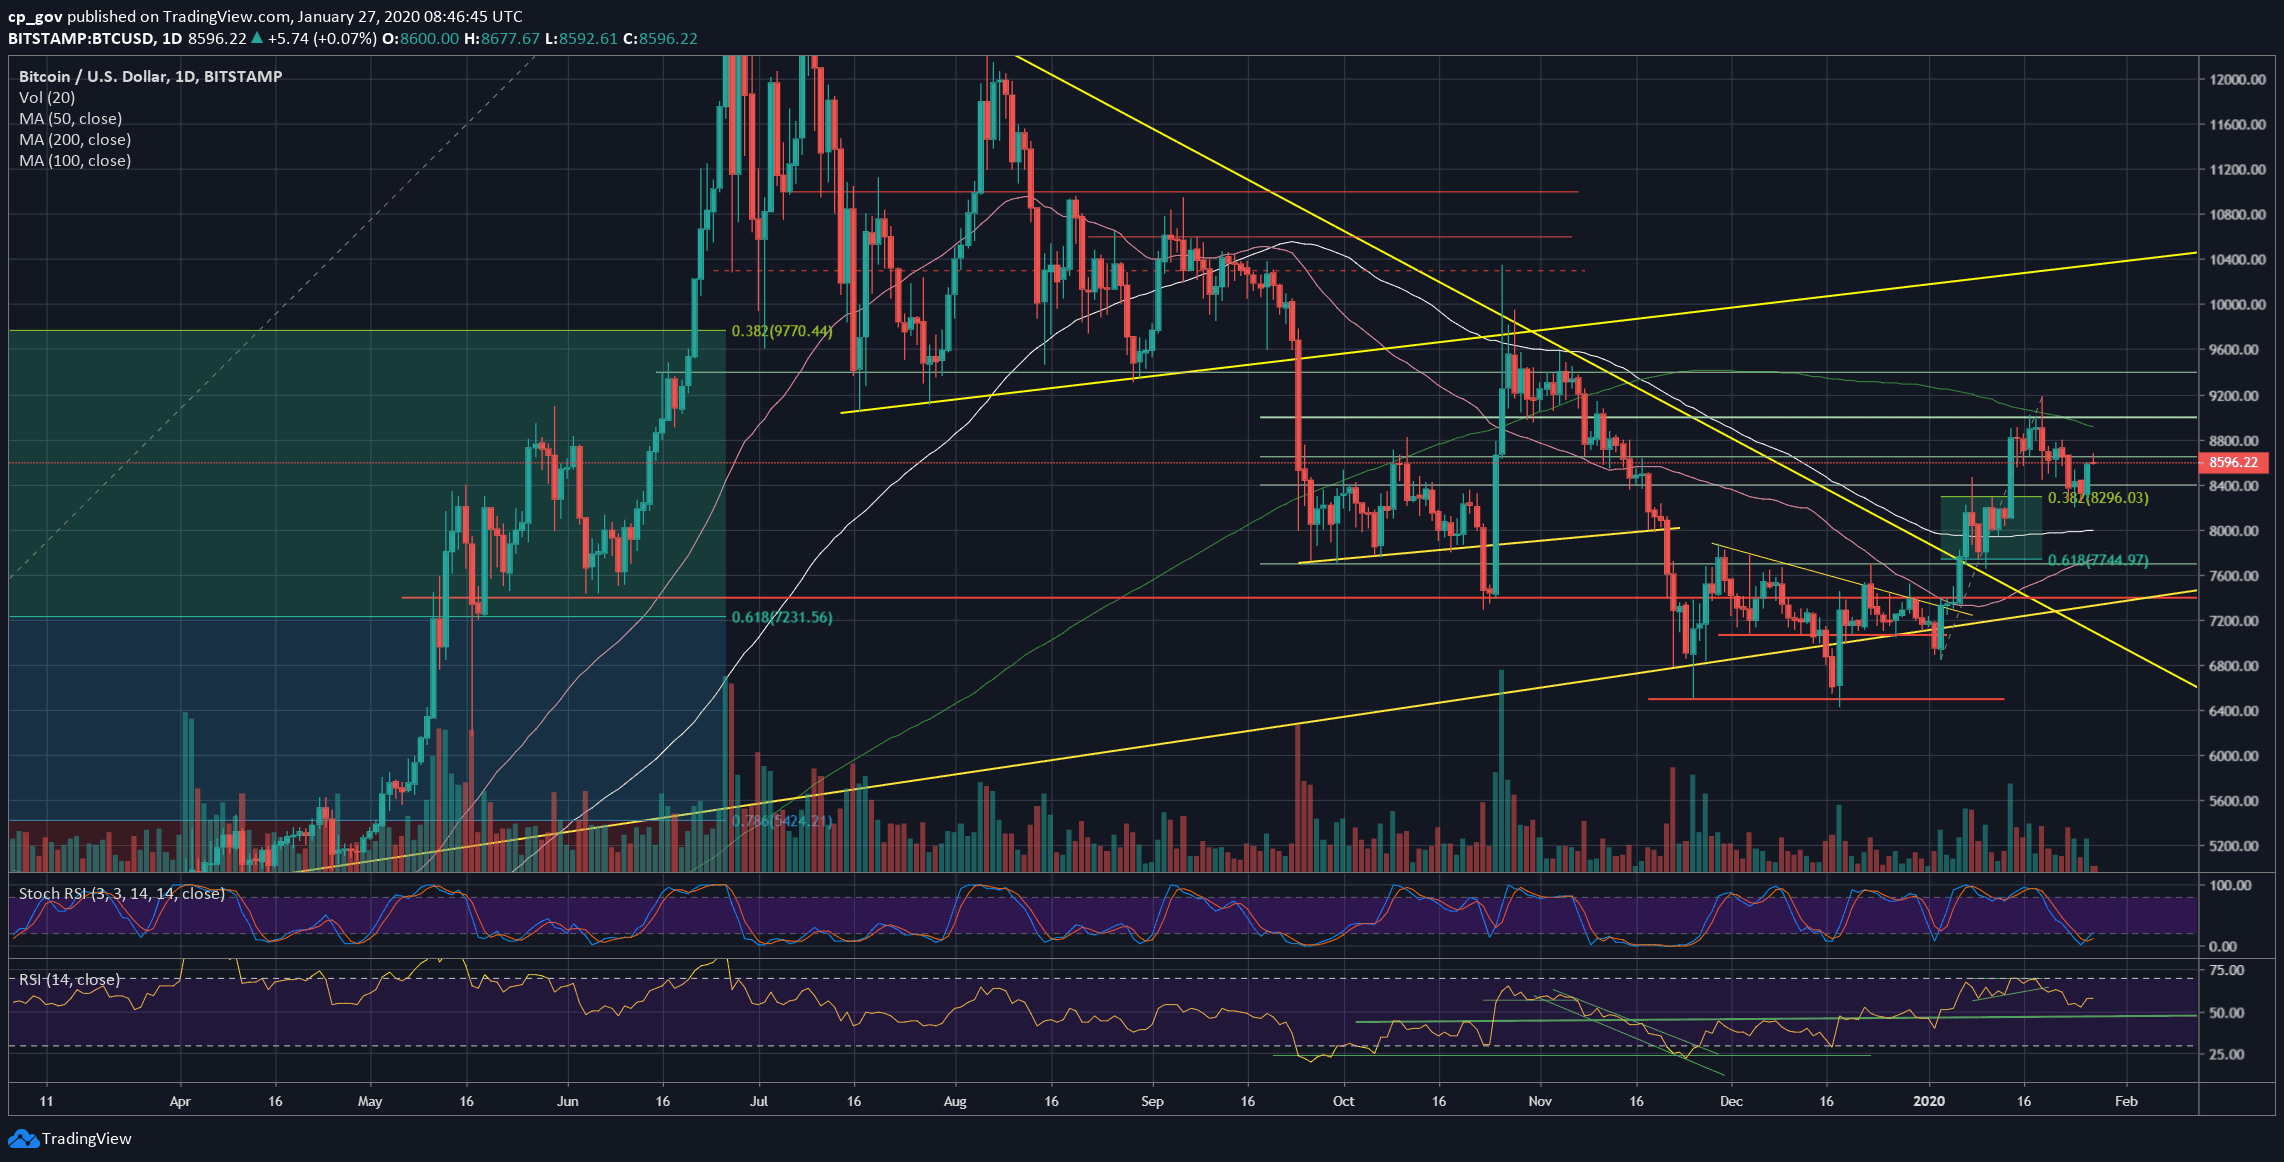
– Support/Resistance levels: Bitcoin is now facing the $8600 price area, further above lies $8800 and $8900, which includes the significant 200-days moving average line (marked by the light green line on the following daily chart). The following resistance will be the $9000 zone, followed by $9200.
From below, the first level of support is the 4-hour’s MA-50 line (marked pink, currently around $8530). The next level of support is $8400 – $8450, which was the resistance of yesterday. Further below is the weekly low at $8200, before reaching the $8000 area, which contains the 100-days moving average line (the white line).
– The RSI Indicator: After finding decent support at 54-55 RSI levels, together with the cross-over mentioned here yesterday of the Stochastic RSI oscillator, the indicator is pointing higher.
– Trading volume: The volume is relatively low over the past days, the Chinese Holidays can explain this.
BTC/USD BitStamp 4-Hour Chart
BTC/USD BitStamp 1-Day Chart
Disclaimer: Information found on CryptoPotato is those of writers quoted. It does not represent the opinions of CryptoPotato on whether to buy, sell, or hold any investments. You are advised to conduct your own research before making any investment decisions. Use provided information at your own risk. See Disclaimer for more information.
Cryptocurrency charts by TradingView.
Technical analysis tools by Coinigy.
The post appeared first on CryptoPotato


")
