
A quick recap of the recent price action: Following a bloody weekend after rejecting from the $10500 resistance level, the current 2020 high, Bitcoin had dropped to its weekly low at $9467 (Bitstamp).
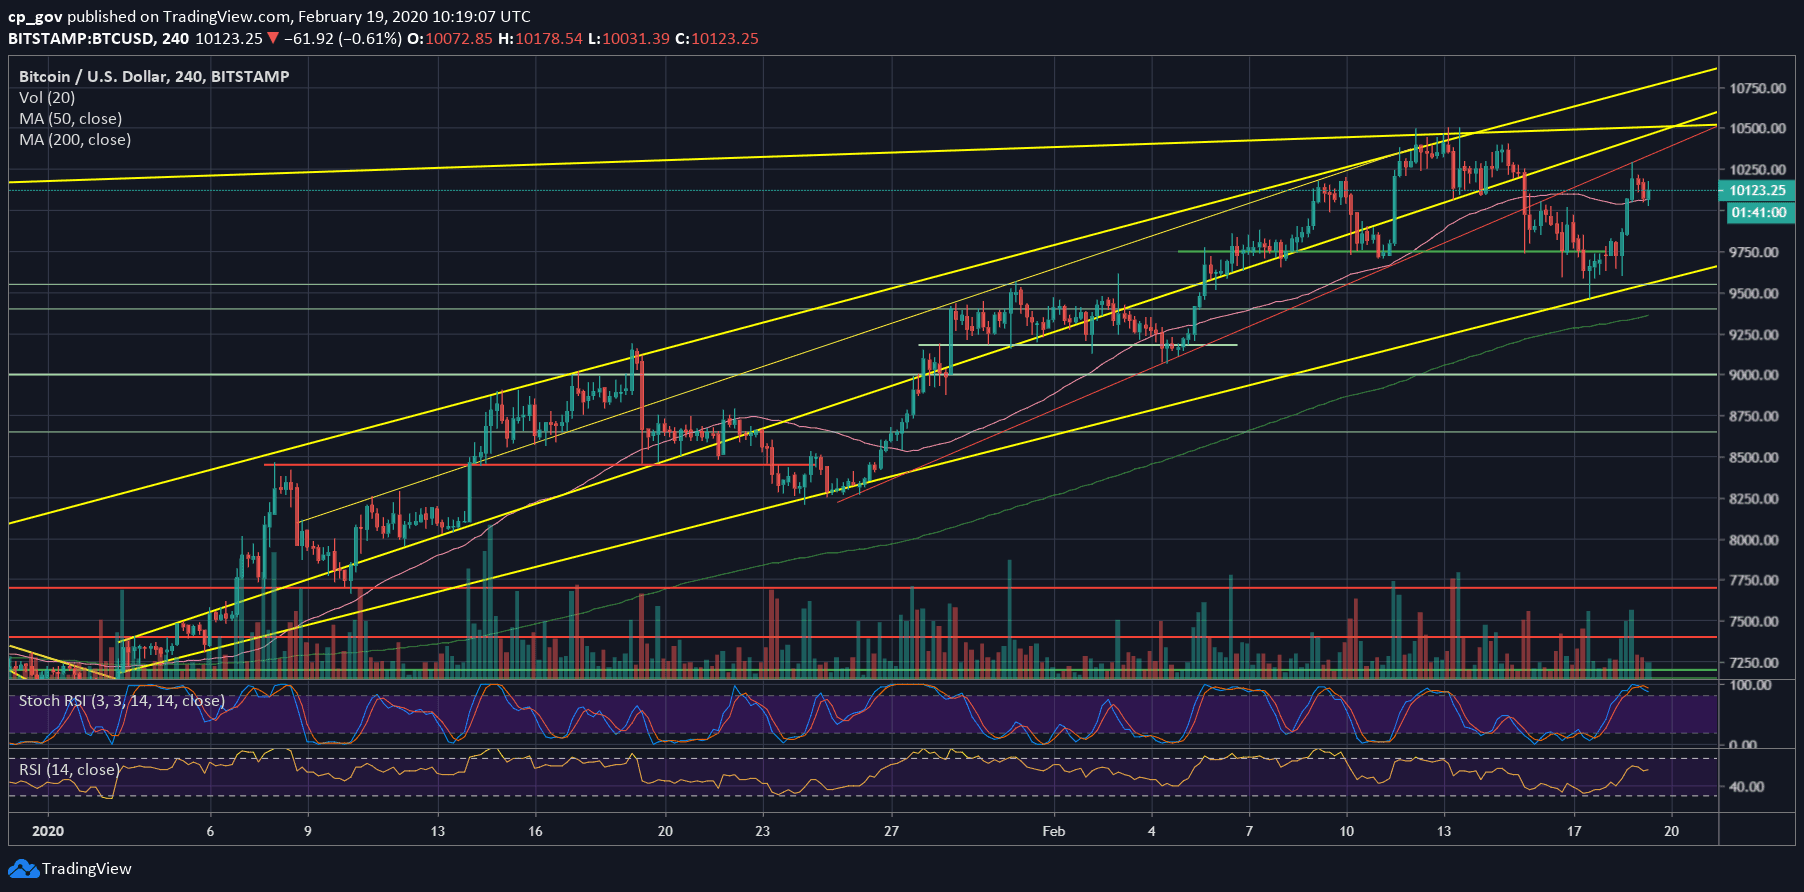
This is not a coincidence, BTC had accurately reached our marked lower descending trend-line that follows Bitcoin’s price action since January 3rd, on the following 4-hour chart.
As we stated here before, since 2020 begun, we see a bullish higher-low trajectory. And yes, corrections are a healthy part of the way to the moon.
So far, since January 1st, we had four significant corrections to the rising trend (which had started when Bitcoin was below $6800). The last of these corrections, of the past days, was sharper from the first three. We expected it to be like this.
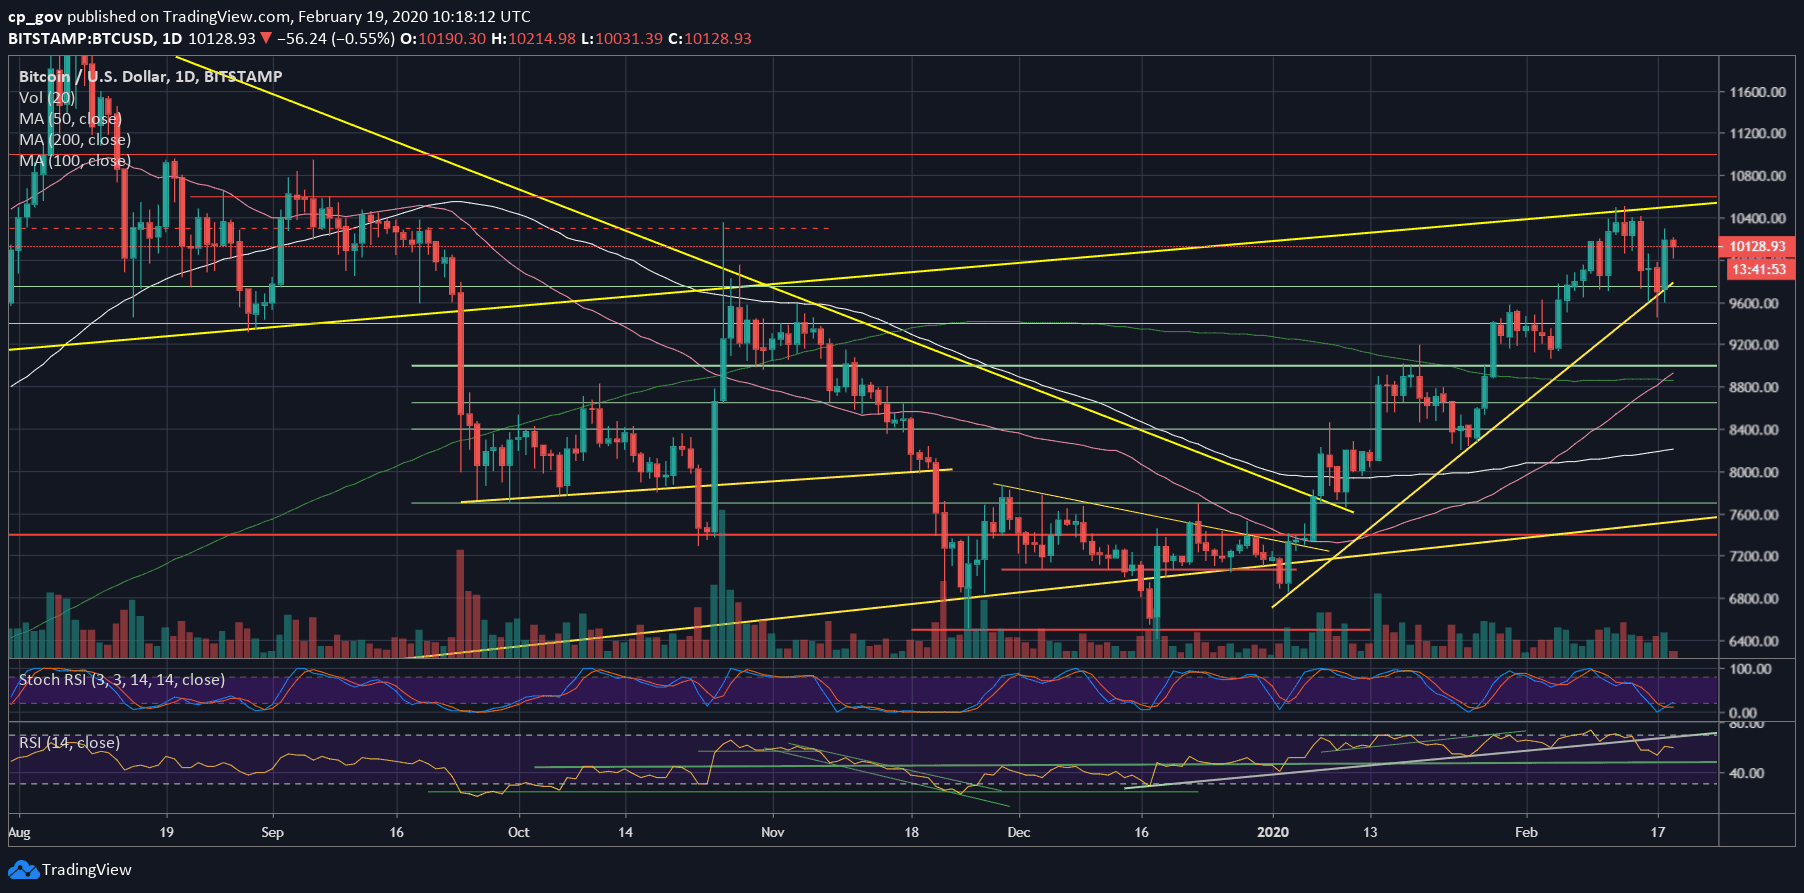
However, following the recent hype around the Golden Cross, which took place yesterday, for the first time since April 2019, Bitcoin price had surged more than $700 intraday.
As of writing these lines, the current 24-hour high lies at $10,288 (Bitstamp), as you might notice, it’s a little below the CME Futures open-gap at $10,400. This bullish come-back just emphasizes the hype around Bitcoin in the halving year of 2020. It seems that it’s only a matter of time until Bitcoin reaches for further highs.
Total Market Cap: $294 billion
Bitcoin Market Cap: $184 billion
BTC Dominance Index: 62.5%
*Data by CoinGecko
Key Levels To Watch & Next Possible Targets
– Support/Resistance levels: As of writing these lines, the first area of resistance is the current price level of $10,200 – $10,300, followed by the 2020 high at $10,500 along with the significant long-term ascending trend-line. The latter was started forming in July 2019.
In case $10,500 breaks, then the next level of resistance is expected to be at $10,600, $10,800, $11,000, and $11,400.
From below, in case Bitcoin fails to maintain the current price level, the first level of support now lies at $10,000. Further below is $9800 and $9600.
– The RSI Indicator: Following the breakdown of the higher lows’ trajectory in the RSI, the indicator found support upon reaching the 60 RSI levels.
The Stochastic RSI oscillator had just made a crossover in the oversold area. This might give fuel for some bullish action.
– Trading volume: The volume is increasing over the past days, which supports the bullish price action. However, the volume levels hadn’t reached the highest volume candles of January yet.
BTC/USD BitStamp 4-Hour Chart
BTC/USD BitStamp 1-Day Chart
Click here to start trading on BitMEX and receive 10% discount on fees for 6 months.
Disclaimer: Information found on CryptoPotato is those of writers quoted. It does not represent the opinions of CryptoPotato on whether to buy, sell, or hold any investments. You are advised to conduct your own research before making any investment decisions. Use provided information at your own risk. See Disclaimer for more information.
The post appeared first on CryptoPotato


