
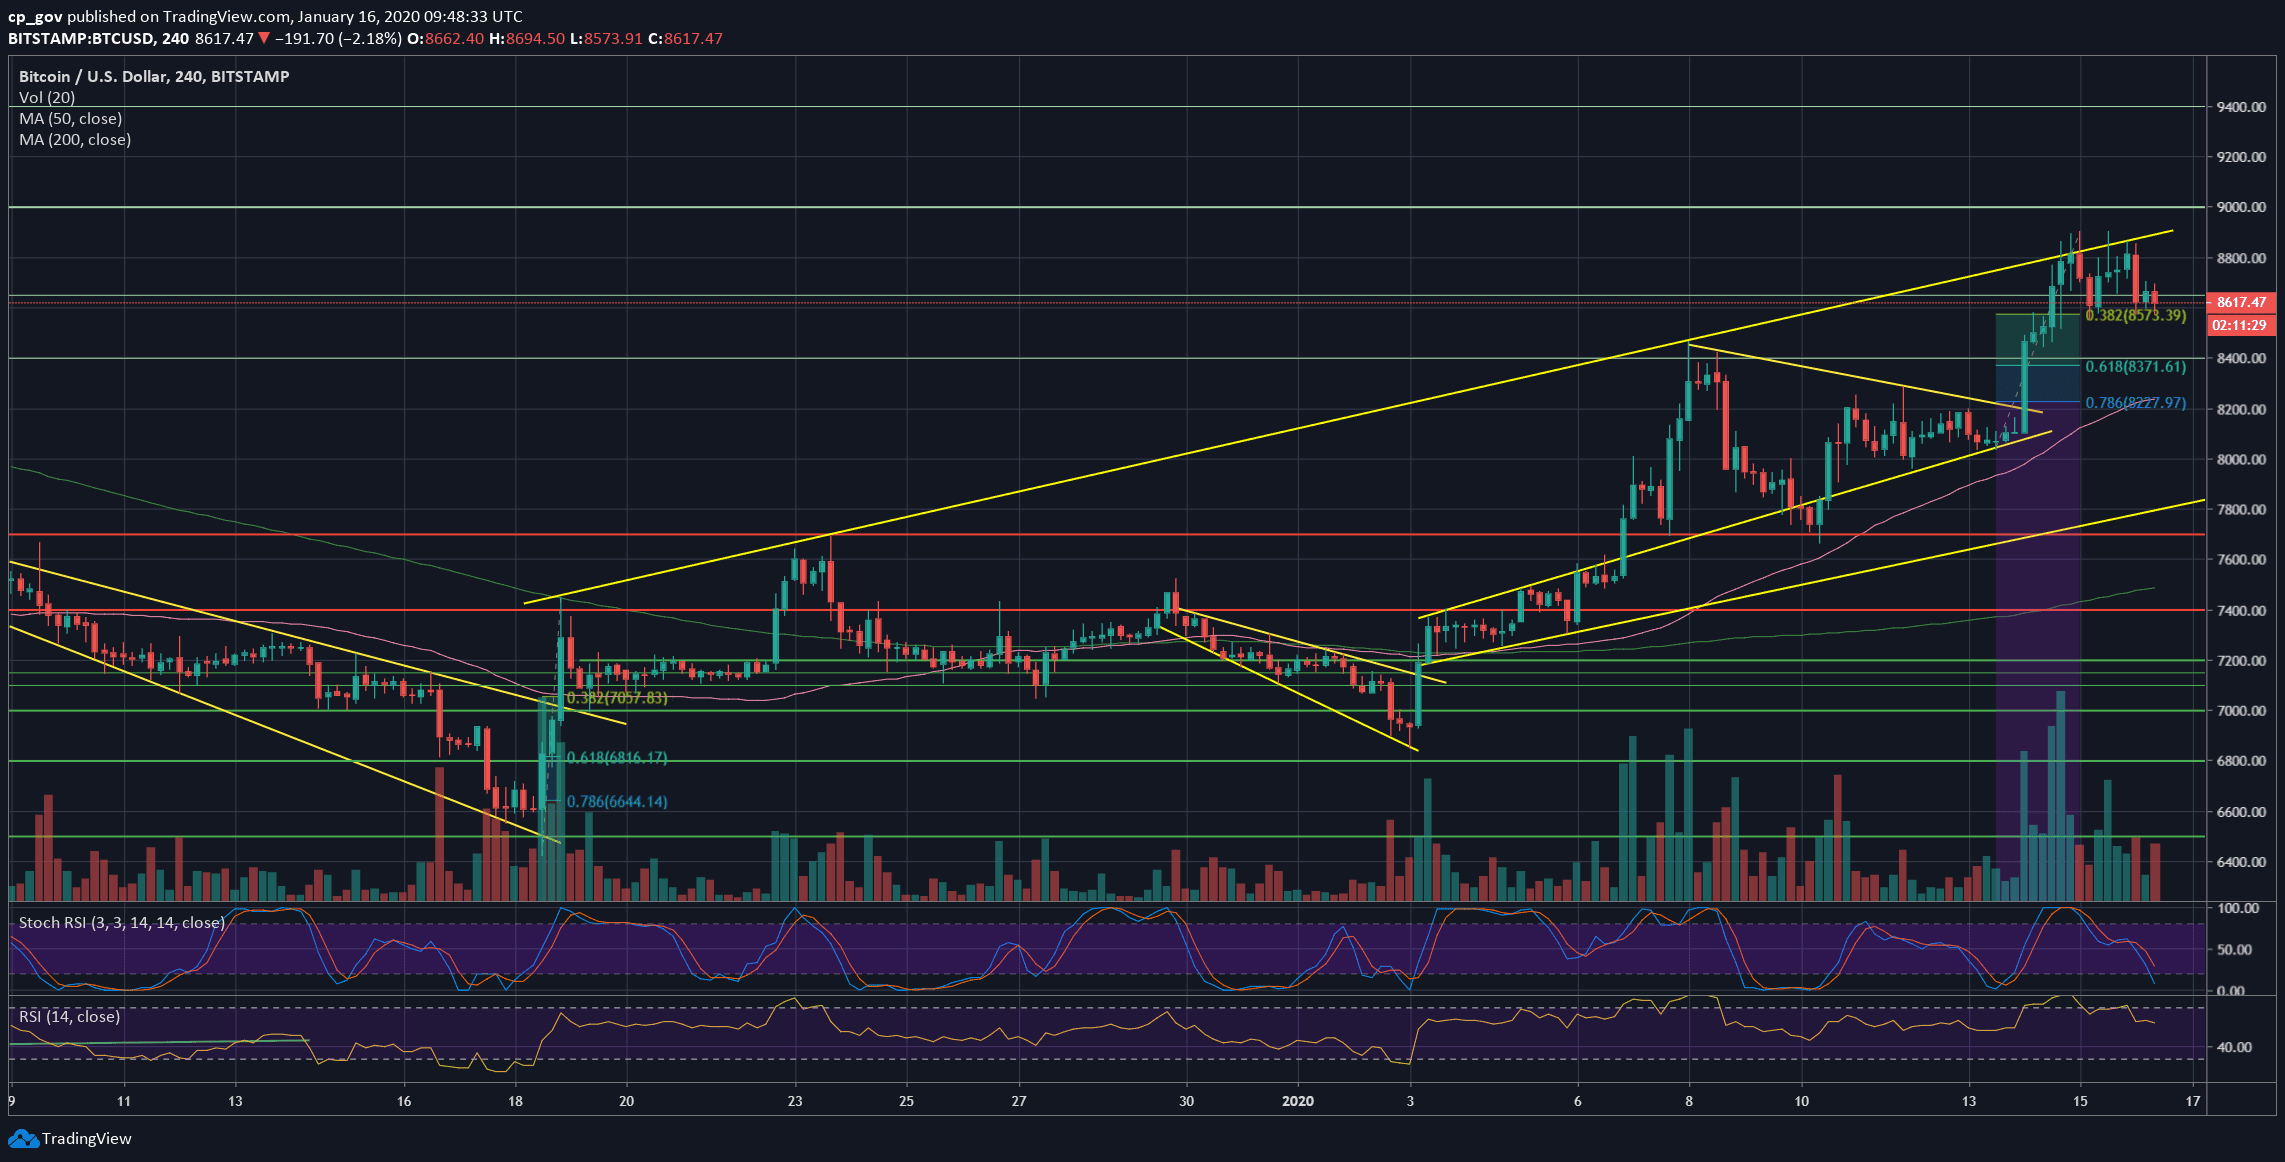
Since breaking the $8600 resistance two days ago, Bitcoin had continued its surge directly to the upper ascending line, the one that is marked on our following 4-hour chart.
It looks like Bitcoin’s rally got a (temp?) ‘roof’ at that ascending trend-line. Why a temp roof? If Bitcoin would like to reach new highs, it’s advisable to do it slowly with corrections and not just a parabolic race (as we had seen during last June).
Besides, As shown on the 4-hour chart, the correction we see so far correlates with the 38.2% Fibonacci retracement level of the recent move (roughly at $8,570).
Another thing to note is the unique situation, where the altcoins are rising more than Bitcoin, as can be said by looking on the Bitcoin dominance dropping towards 66%. This might be a sign that new money is entering the cryptocurrency markets (and not that altcoins are sold for Bitcoin, again, as happened during the bull-run of June 2019).
Total Market Cap: $235.7 billion
Bitcoin Market Cap: $157.3 billion
BTC Dominance Index: 66.7%
*Data by CoinGecko
Key Levels To Watch & Next Targets
– Support/Resistance levels: Since reaching $8900, Bitcoin had gone through a correction, and now facing the $8600 resistance turned support level, along with the 38.2% Fib retracement level ($8570).
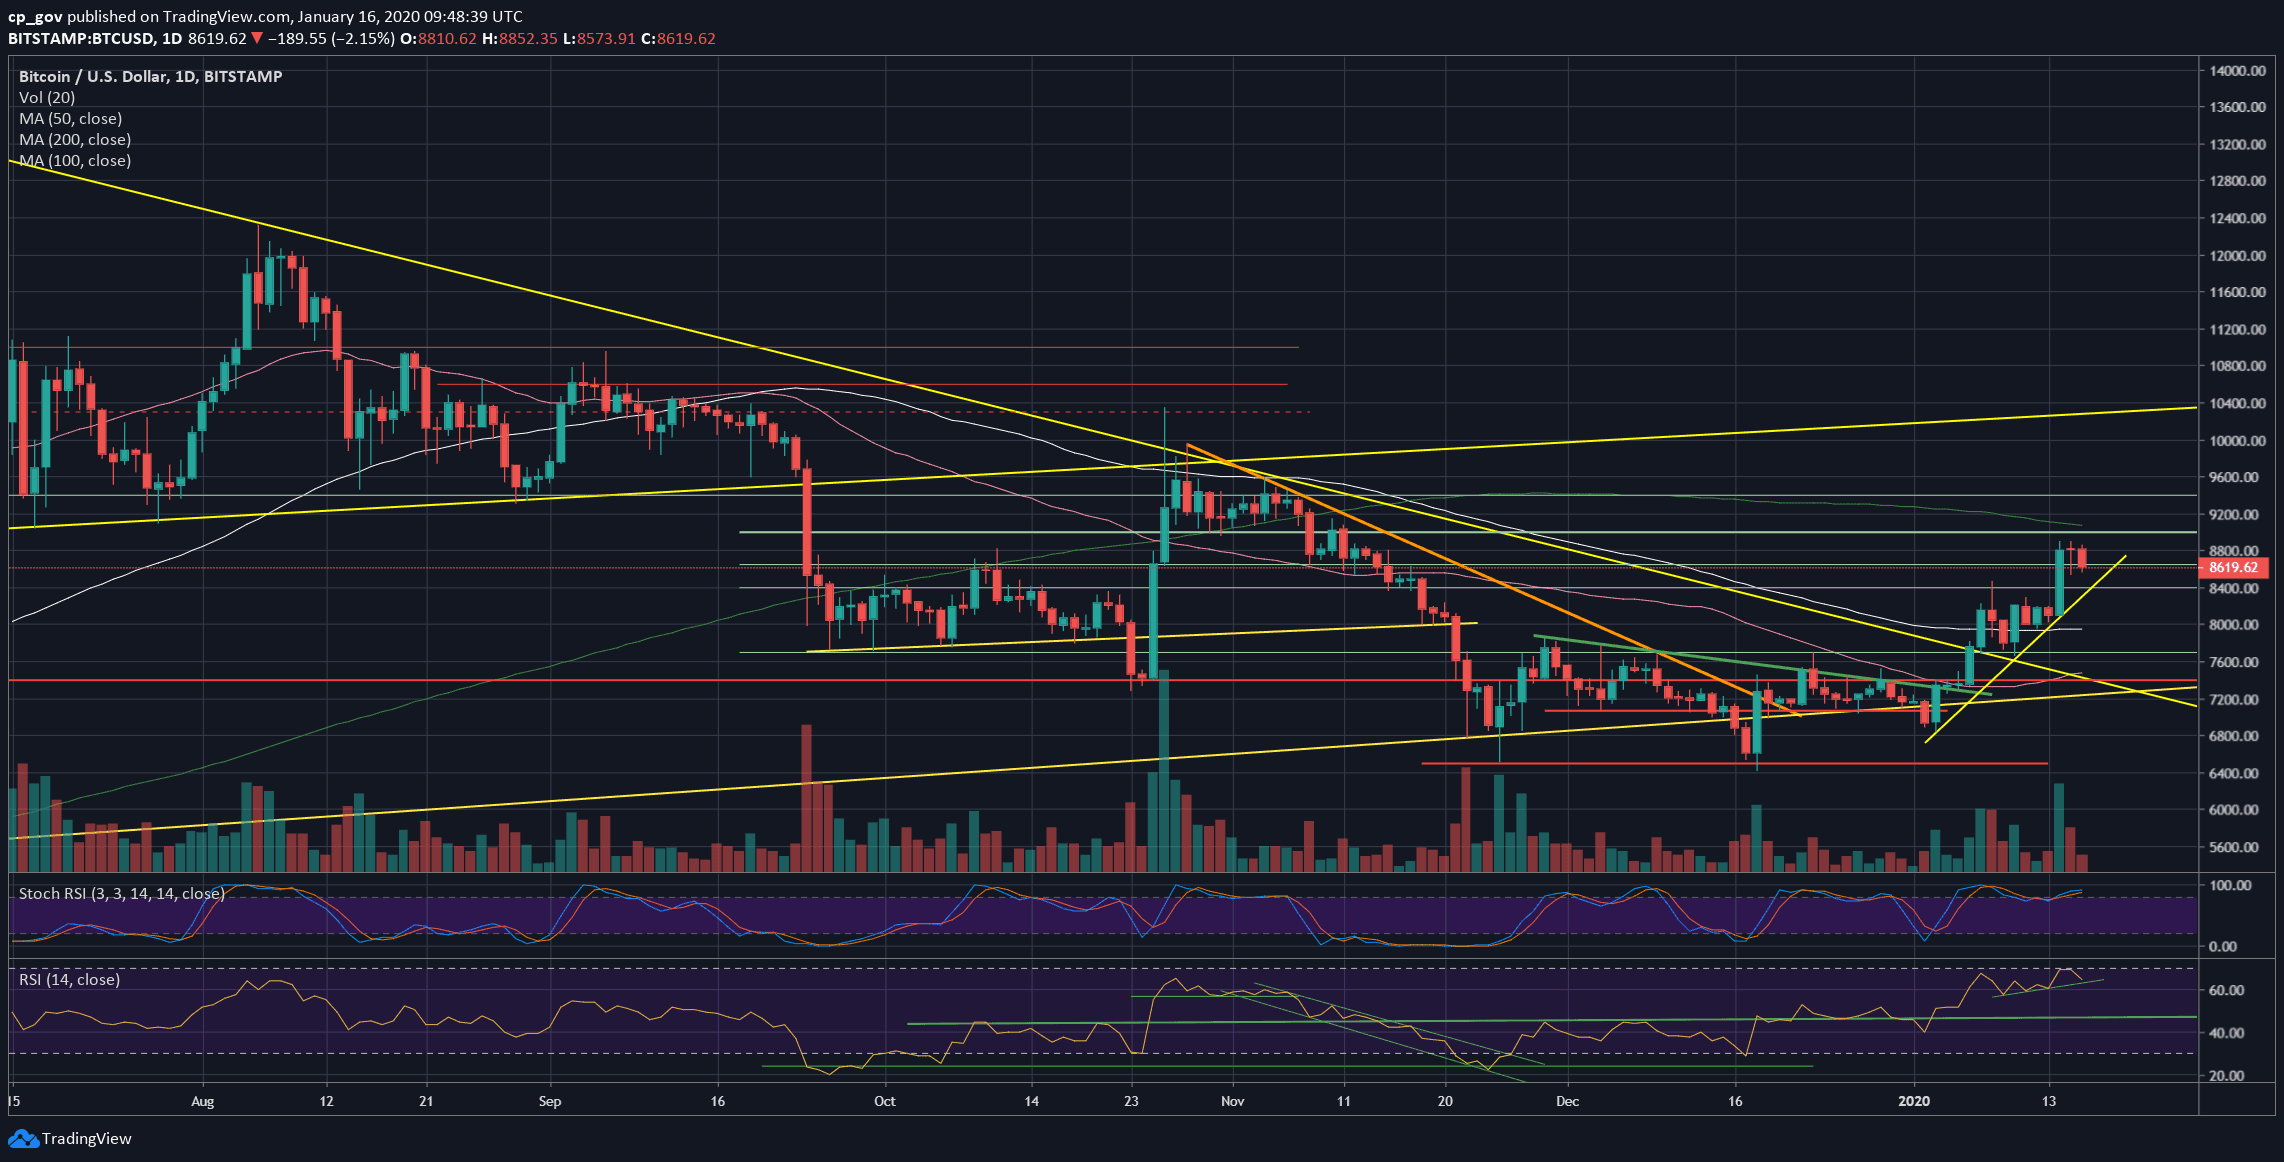
In case the above level won’t hold, we could expect Bitcoin to retest the next support level, which is the significant $8400 zone, along with the ascending trend-line shown on the daily chart and the 61.8% Fib level. Further down is $8300 and $8200.
From above, the recent highs of $8800 – $8900 is the first line of resistance (the upper ascending trend-line of the marked channel on the 4-hour chart). Further above is the crucial 200-days moving average line (marked by a light green line) – currently around $9050. Further above is the $9300 – $9400 resistance area.
– The RSI Indicator: On our recent analysis, we pointed out the bearish divergence on the RSI, which could have told that the end of the bull-run is near. Looking at the current state of the momentum indicator, we can still that despite the drop, the RSI is still on the ascending track.
– Trading volume: The mini-rally we saw two days ago had marked the highest volume day since the 25 of November 2019, which is impressive.
BTC/USD BitStamp 4-Hour Chart
BTC/USD BitStamp 1-Day Chart
Disclaimer: Information found on CryptoPotato is those of writers quoted. It does not represent the opinions of CryptoPotato on whether to buy, sell, or hold any investments. You are advised to conduct your own research before making any investment decisions. Use provided information at your own risk. See Disclaimer for more information.
Cryptocurrency charts by TradingView.
Technical analysis tools by Coinigy.
You might also like:
The post appeared first on CryptoPotato


