
So far, the month of December 2019 reminds us of the cruel month of December 2018.
Last year it was the capitulation candle to $3122 that was achieved on December 15. This year’s December isn’t disappointing the bears at all: from the monthly high that was reached on Dec 4 at $7770, down to $6530, which is the current low on Bitstamp as of writing these lines.
The bearish momentum is all over, and if you were following, we had stated that here in the previous price analysis posts over the past week.
Losing The Mid-Term Support Line
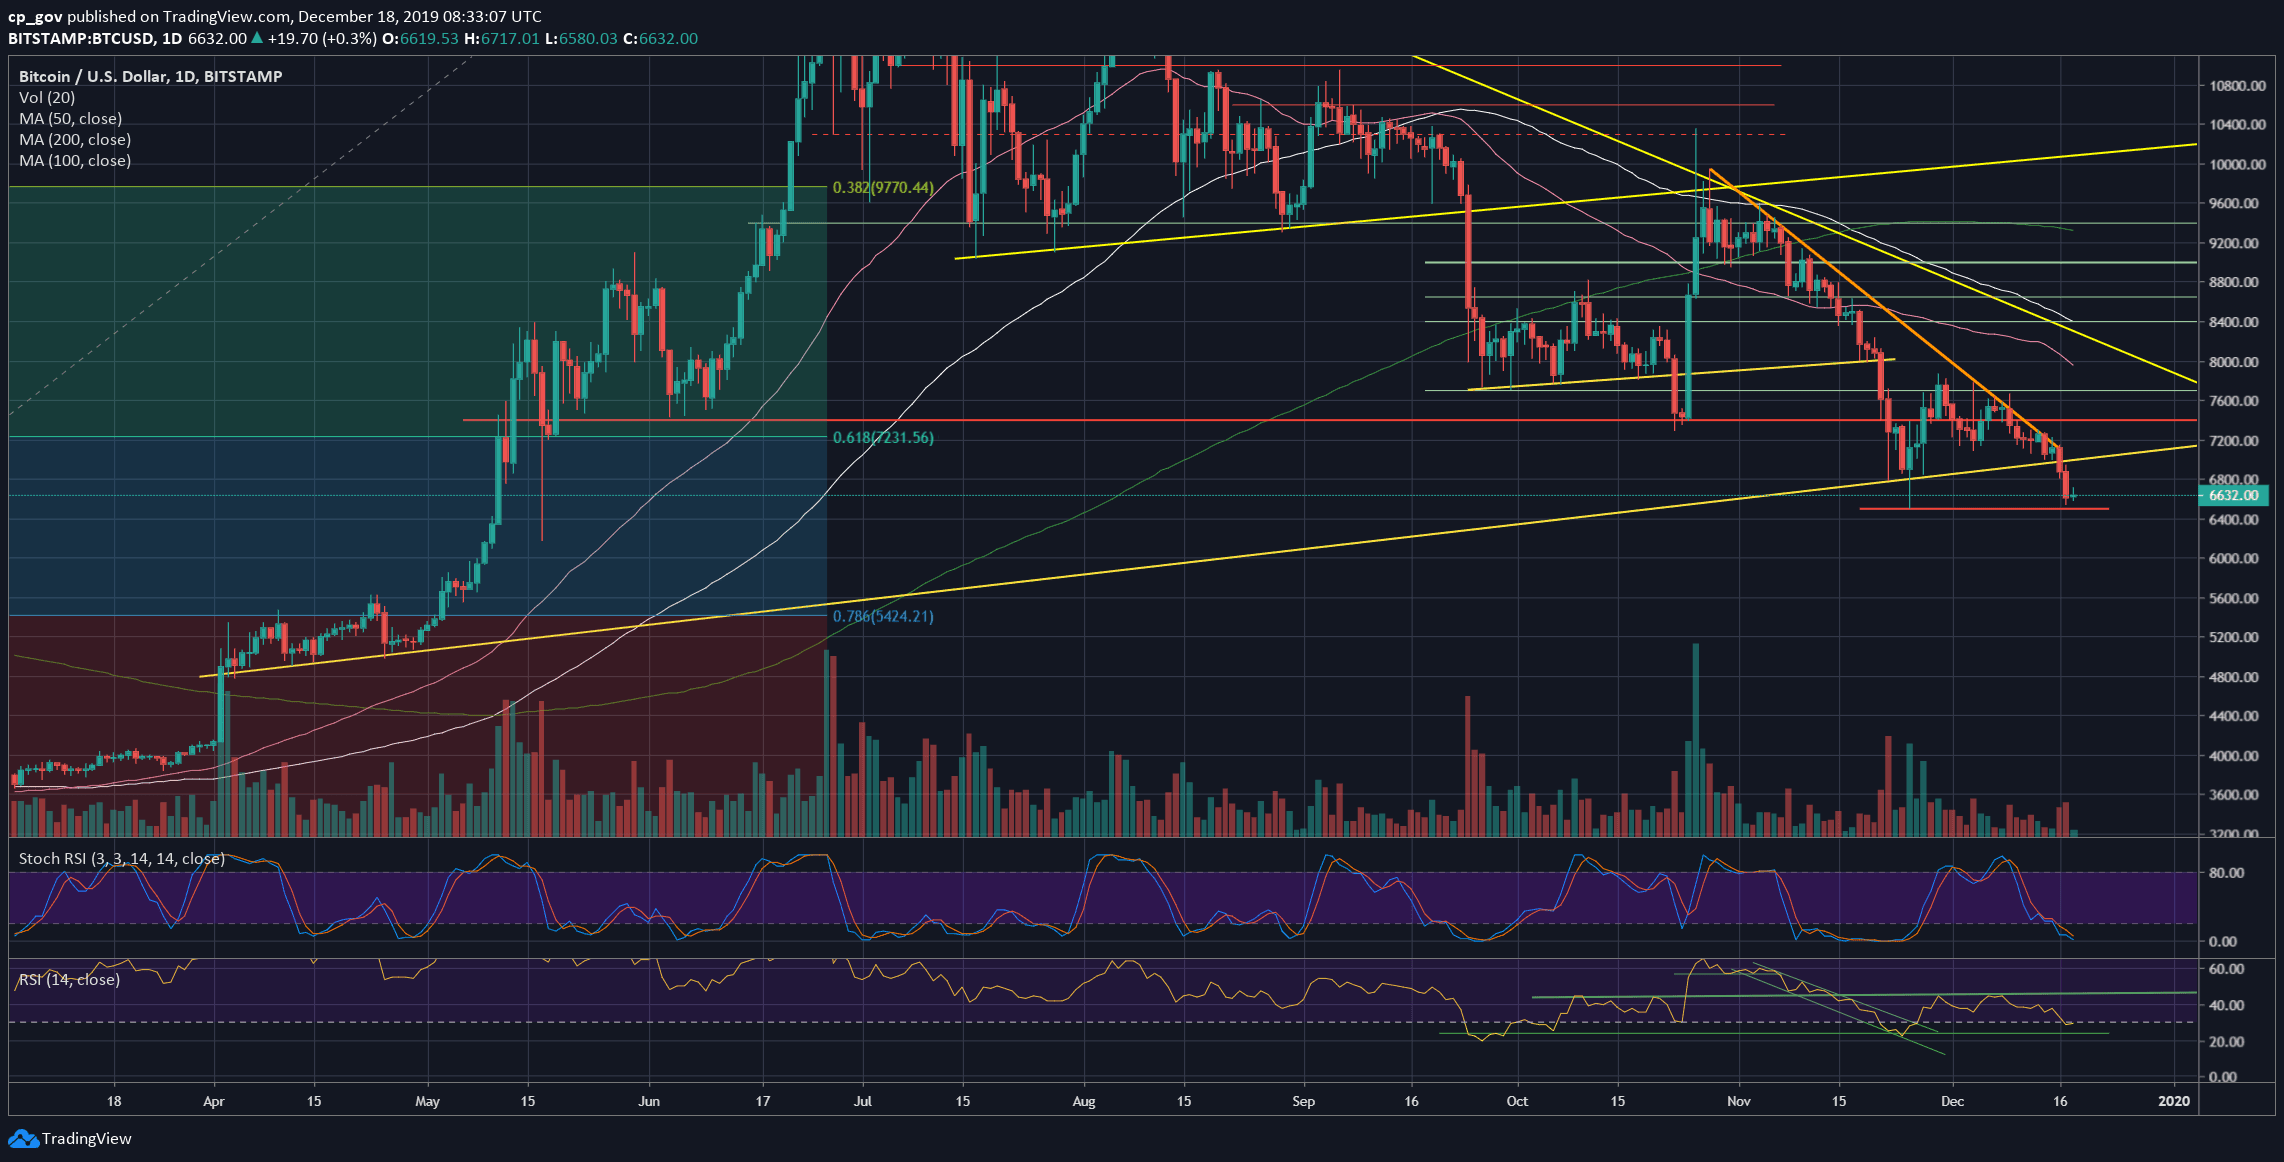
Technically, we can see the apparent breakdown of the mid-term ascending trend-line at $6970, the trend-line that started forming in April, marked on the following daily chart.
Following the breakdown, we can see the candle close of Monday below it, while Tuesday’s candle went up to confirm it as support turned resistance line. From there, the bloodbath had begun, whereas Bitcoin plunged almost $500 in 24 hours period.
The next target we mentioned was $6500, which is the current low. As can be seen on the daily chart, this is also the November 25 low. However, back then, it ended up as a daily candle’s wick and just four days ago the price recovered up to $7870. In this case, the story is different.
The only bullish possibility is in case this setting turns into a double-bottom or a “W” shape pattern, where Bitcoin would have to break above the $7700 resistance line to return bullish. As of now, this looks far from reality, but things can change quickly in crypto.
Ethereum is not left behind
As stated here on the previous analysis, the significant altcoins are dropping in their Bitcoin value. This can tell us on funds leaving the crypto markets. In my opinion, as a first sign, we will have to look for a correction in those altcoins (i.e., Ethereum, Ripple) to start thinking of a possible break in the downtrend.
Total Market Cap: $179 billion
Bitcoin Market Cap: $121 billion
BTC Dominance Index: 67.6%
*Data by CoinGecko
Key Levels to Watch
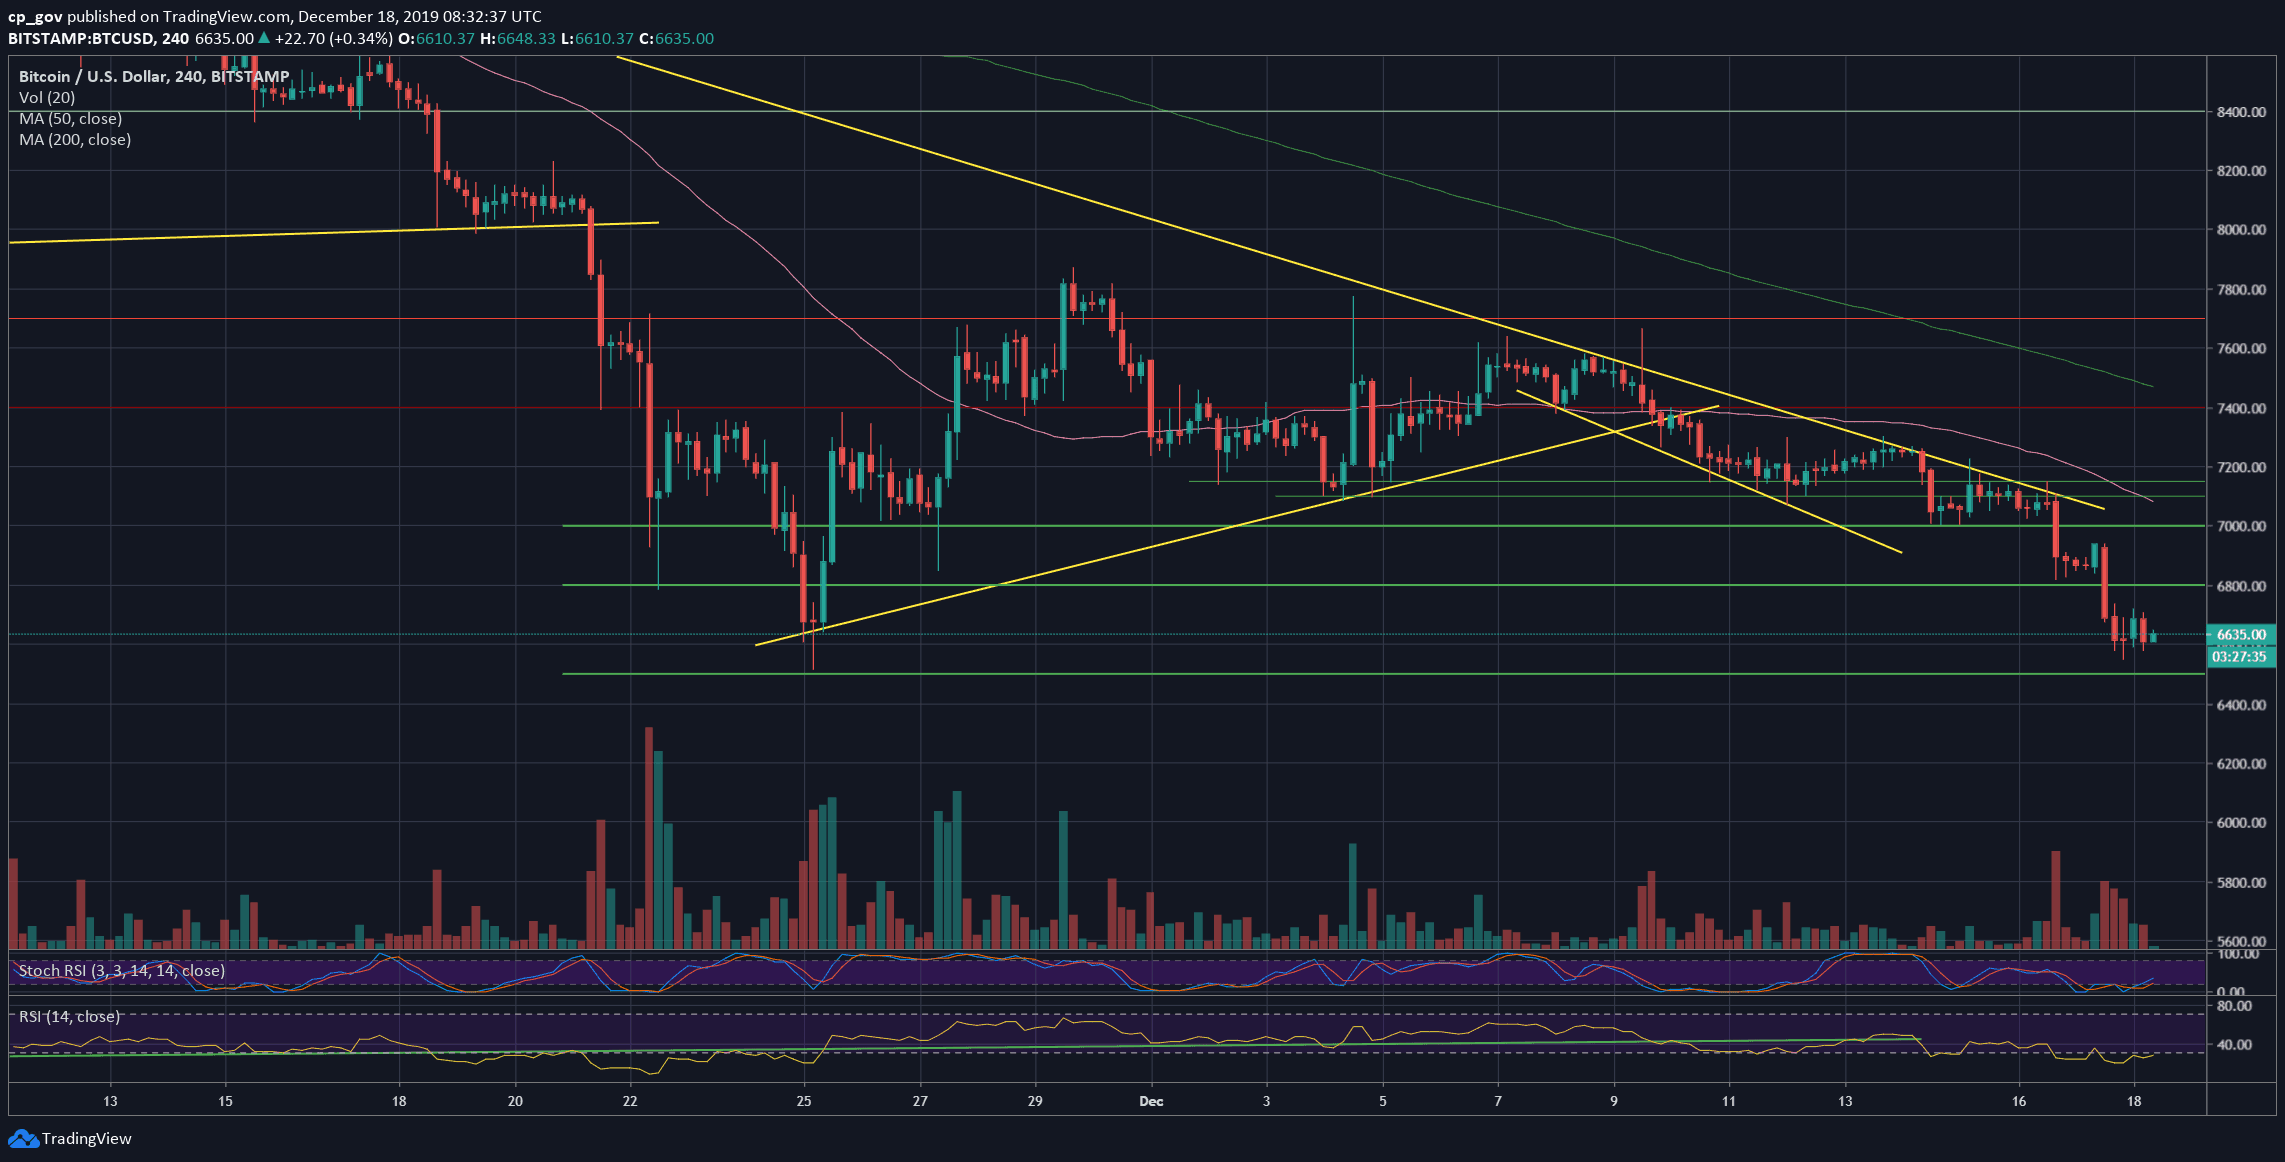
– Support/Resistance: As mentioned above, Bitcoin had achieved the $6500 target. As of now, it is trading sideways around the $6500 – $6600 confluence zone.
In case of a breakdown from here, then $6300 might be the next possible target. Further down is $6100 and $6000. If we zoom out a bit, we can start seeing $5400 as a potential longer-term target.
The last is the 78.6% Fibonacci retracement level of the 2019 first half bullish move (up to $13,880 in June).
From the bullish side, in the case of a correction, the first major support turned resistance level is $6800. Further above is $7000, along with the mid-term ascending trend-line.
The next significant level is $7300, which is the Golden Fibonacci level of 61.8%.
– The RSI Indicator: As stated here two days ago: “There is still more room to go down by looking at the RSI.” Since then, we saw another $300 – $400 down.
The RSI is now at 30, which might serve as temp support. So far, no divergence, or nothing indicating of possible accumulation.
– Trading volume: The trading volume indeed rose; however, this is far from the peak levels of November. It might also be related to the fact that many traders are off on their end of the year’s vacation, which is another key to keep in mind till January 2020.
BTC/USD BitStamp 1-Day Chart
BTC/USD BitStamp 4-Hour Chart
Disclaimer: Information found on CryptoPotato is those of writers quoted. It does not represent the opinions of CryptoPotato on whether to buy, sell, or hold any investments. You are advised to conduct your own research before making any investment decisions. Use provided information at your own risk. See Disclaimer for more information.
Cryptocurrency charts by TradingView.
Technical analysis tools by Coinigy.
You might also like:
The post appeared first on CryptoPotato


