
Bitcoin price is trading with a positive bias and recently climbed above $10,800 against the US Dollar.The price is currently trading above the $10,500 support and it could continue to rise in the near term.Yesterday’s highlighted key bullish trend line is providing support near $10,510 on the hourly chart of the BTC/USD pair (data feed from Kraken).The price is likely to grind higher as long as there is no close below the $10,400 support area.Bitcoin price is showing a lot of positive signs above $10,500 against the US Dollar. BTC remains supported for more gains towards the $11,000 and $11,200 resistance levels.Bitcoin Price AnalysisYesterday, we saw strong gains in BTC above the $10,500 resistance area against the US Dollar. The price traded close the $10,800 level and later corrected lower below $10,700. Moreover, there was a break below the $10,550 level, but the $10,400 level acted as a strong support area. As a result, the price climbed higher and broke the last swing high near $10,790. A new monthly high was formed near $10,888 and recently the price corrected lower.It traded below the $10,600 level plus the 50% Fib retracement level of the recent wave from the $10,321 low to $10,888 high. However, the decline was protected by the $10,500 support area. Additionally, yesterday’s highlighted key bullish trend line is providing support near $10,510 on the hourly chart of the BTC/USD pair. The 76.4% Fib retracement level of the recent wave from the $10,321 low to $10,888 high also protected downsides.At the moment, the price is trading with a positive angle above the $10,600 level. On the upside, an immediate resistance is near the $10,700 and $10,800 levels. If there is a successful close above $10,800, the price is likely to accelerate higher above the $10,880 and $10,900 levels. The next key resistance is near the $11,000 level. If there are more gains, the price could test the $11,200 resistance area.Conversely, if the price fails to break the $10,700 and $10,800 resistance levels, it could correct lower. An initial support is near the $10,500 level. However, the main support is near the $10,400 level, below which the price could extend its decline towards the $10,200 support and the 100 hourly SMA.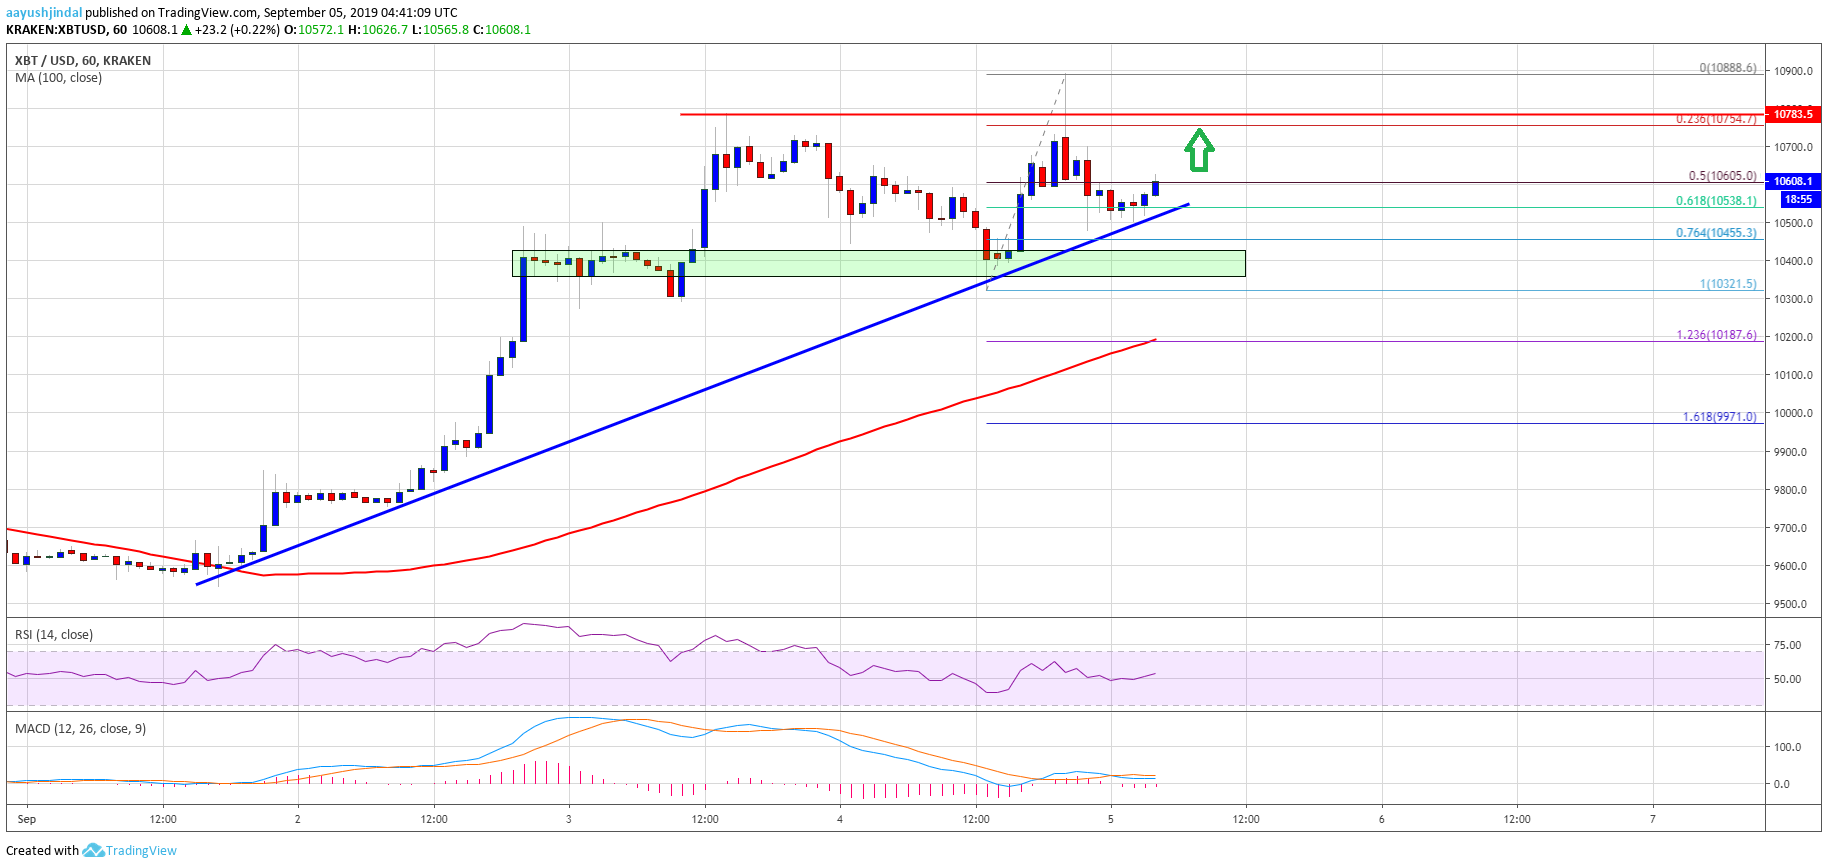 Looking at the chart, bitcoin price is likely to grind higher as long as there is no close below the $10,400 support area. It seems like the bulls are aiming an upside break above $11,000 in the coming sessions.Technical indicators:Hourly MACD – The MACD is about to move back into the bullish zone.Hourly RSI (Relative Strength Index) – The RSI for BTC/USD is moving higher and is currently above the 50 level.Major Support Levels – $10,500 followed by $10,400.Major Resistance Levels – $10,700, $10,800 and $11,000.The post appeared first on NewsBTC


