
The Bitcoin bulls didn’t expect that this is how the new decade would start, but this is Bitcoin, always doing the unexpected.
This might also be true regarding the current halving year. The Bitcoin halving event is anticipated to take place somewhere in the middle of May. The majority of the crypto community are eager to see the price “going to the moon,” however, as more traders expect X, then usually Y takes place.
One thing we can say for sure is that 2020 going to be another volatile year for Bitcoin.
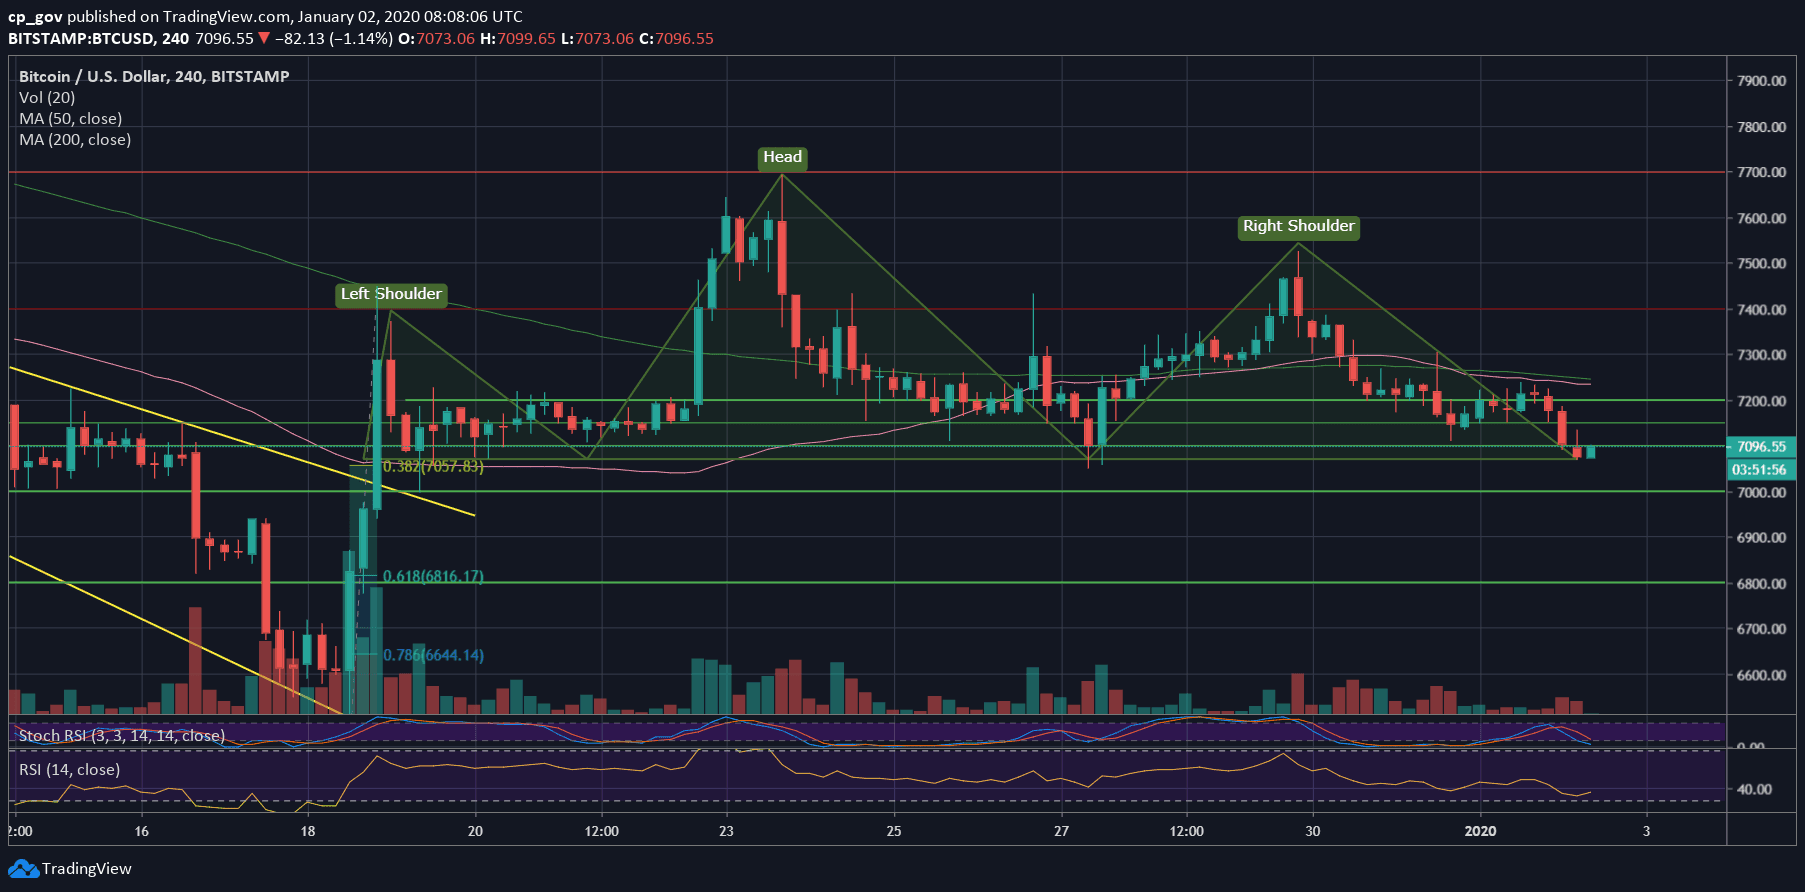
Head & Shoulders coming up?
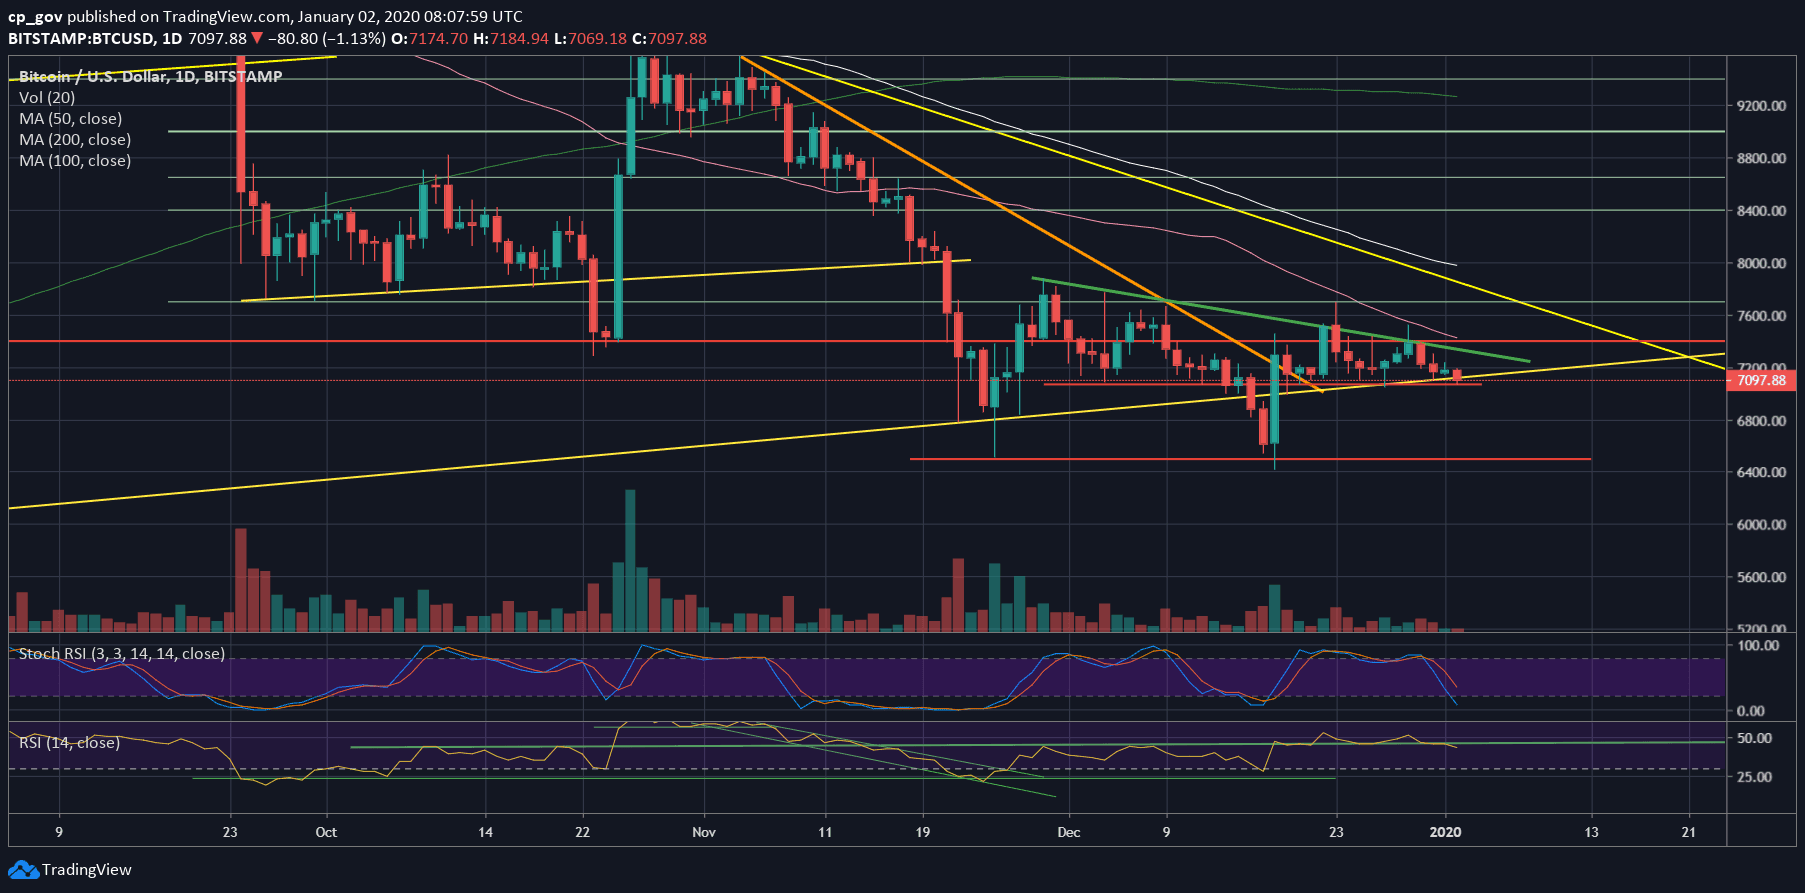
Let’s get back to our charts: On the following daily chart we can see the decision point Bitcoin price is facing now. This yellow ascending trend-line has been built and kept (except for a short fake-out) since April 2019.
Together with the horizontal support level at $7070 and $7000, it might be the last boundary before playing out the pattern drawn on the following 4-hour chart.
This massive Head and Shoulders is a bearish pattern, and if played out, then its target is somewhere around $6500, which is not a coincidence, since this is the lowest price of Bitcoin since May 2017. During the past five weeks, Bitcoin tested and nicely bounced back from that support area.
Total Market Cap: $189 billion
Bitcoin Market Cap: $129 billion
BTC Dominance Index: 68.2%
*Data by CoinGecko
Key Levels to Watch
– Support/Resistance: As mentioned above, Bitcoin is now facing support at $7070 and $7000. In case of a break-down, then the next target could be weak support of $6800.
Further down lies the low mentioned above, at $6500 – $6600.
From above, the first level of resistance is around $7150, where lies the April 2019 ascending trend-line. Above is $7200, before the descending trend-line and the confluence price area of $7300 – $7400.
– The RSI Indicator: As discussed here almost daily, the RSI is ‘stuck’ at the 44-45 horizontal level for the past two weeks. Now, we are starting to see bearish signs here, as the indicator breaks below the critical support.
– Trading volume: The volume is low compared to the past month, and it’s probably because of the holidays. On top, we can see declining bars of daily volume, which technically indicate a coming up move.
BTC/USD BitStamp 4-Hour Chart
BTC/USD BitStamp 1-Day Chart
Disclaimer: Information found on CryptoPotato is those of writers quoted. It does not represent the opinions of CryptoPotato on whether to buy, sell, or hold any investments. You are advised to conduct your own research before making any investment decisions. Use provided information at your own risk. See Disclaimer for more information.
Cryptocurrency charts by TradingView.
Technical analysis tools by Coinigy.
You might also like:
The post appeared first on CryptoPotato


