
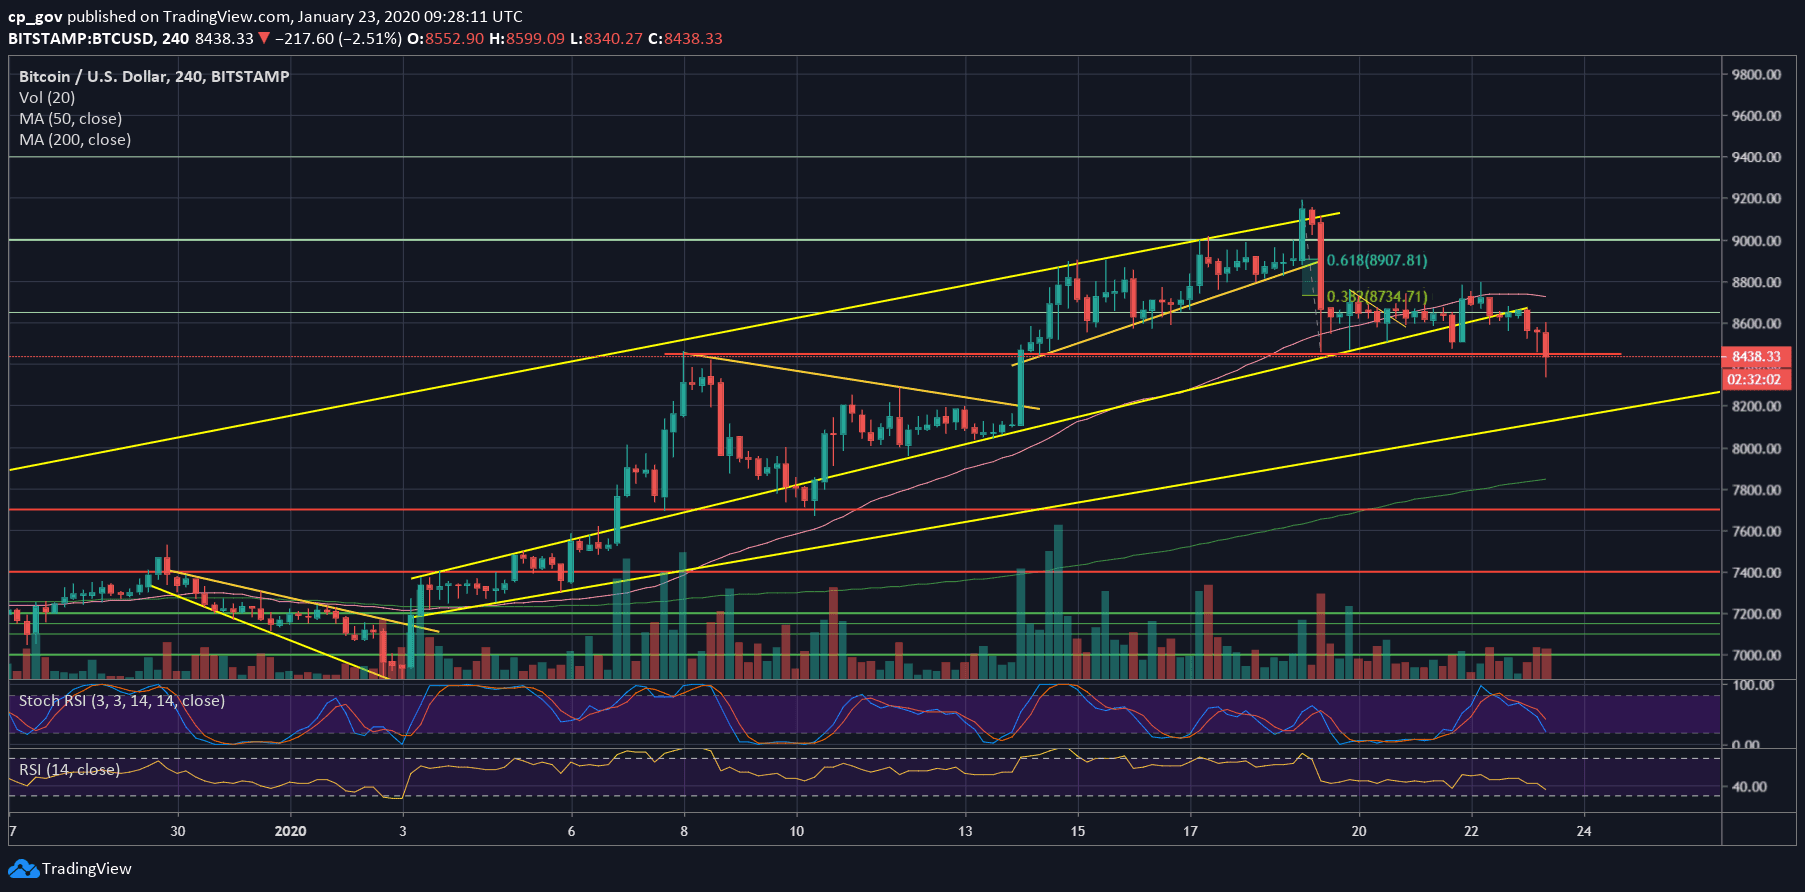
A quick recap to the last Bitcoin’s price action from the past week: After touching the 200-days moving average line (~$9060), Bitcoin got rejected and quickly dropped into the $8600 support area, after creating a wick down to $8450.
Since the first touch on this crucial support line (four days ago), we had seen Bitcoin trading around $8600. However, there was a negative bias in the recent price action, as mentioned in the previous price analysis.
The $8450 support line had seen three attempts, over the last four trading days, that quickly got picked up by the bulls. As of writing these lines, minutes ago it was the first time that this significant support level seems to be cracking down. For the first time in ten days, Bitcoin was trading for under $8400.
Is this the beginning of another bearish leg to the downside? Will the $8450 support hold once again? It’s hard to say as of writing this update; however, there is tremendous support nearby that might hold Bitcoin.
Total Market Cap: $234.5 billion
Bitcoin Market Cap: $154.5 billion
BTC Dominance Index: 66.0%
*Data by CoinGecko
Key Levels To Watch & Next Targets
– Support/Resistance levels: As mentioned above, Bitcoin is fighting over the $8400 – $8450 support area.
A little below is the $8300 level, along with the Fibonacci retracement level of 38.2% (from January’s recent surge), before the ascending trend-line along with the $8200 support. Down below is the $8000 area, which contains the significant 100-days moving average line (marked by white).
Looking from the bullish side, in case that Bitcoin holds up the $8450 zone, then the first resistance would be the $8600, which is a support turned resistance level. Further above lies $8730 – $8750, which is the 38.2% Fib retracement level from the recent severe drop four days ago.
– The RSI Indicator: As been previously said here about the bearish momentum of the RSI following breaking down the short-term ascending trend-line, the RSI is now facing some good-old resistance turned support level at 54 – 55. However, there is still room to go down.
– Trading volume: Since the surge ten days ago on January 14, the trading volume keeps on declining. This is a sign that a big move is likely coming up soon.
BTC/USD BitStamp 4-Hour Chart
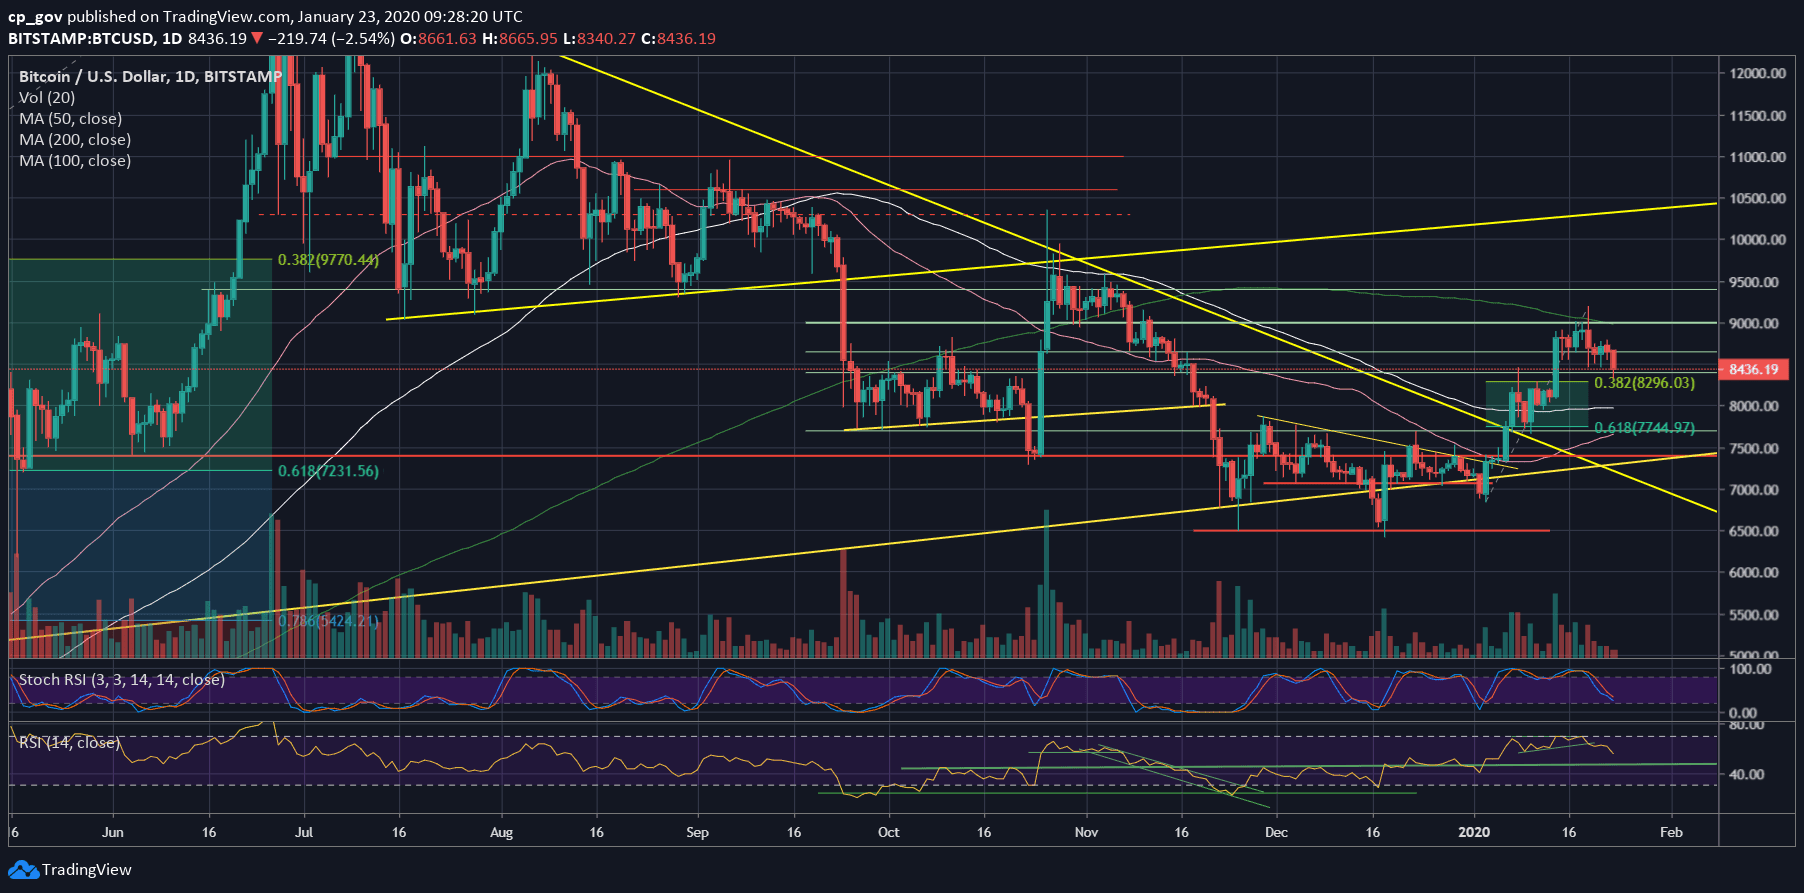
BTC/USD BitStamp 1-Day Chart
Disclaimer: Information found on CryptoPotato is those of writers quoted. It does not represent the opinions of CryptoPotato on whether to buy, sell, or hold any investments. You are advised to conduct your own research before making any investment decisions. Use provided information at your own risk. See Disclaimer for more information.
Cryptocurrency charts by TradingView.
Technical analysis tools by Coinigy.
The post appeared first on CryptoPotato


