
Bitcoin just completed a daily surge of more than $400, marking $8580 as its current daily high. Yes, maybe when you’re reading these lines, the king of the cryptocurrencies had continued its way even higher.
Three days ago, on our recent price analysis, we had stated clearly that the short-term looks bullish for Bitcoin.
The consolidation above the $8000 was exactly what Bitcoin needed to regain forces for the move we just saw over the past hours.
Following the parabolic rise of NASDAQ, the money – or part of it – is finally reaching the cryptocurrency markets. Since 2020 had begun, Bitcoin is up more than 20% (!).
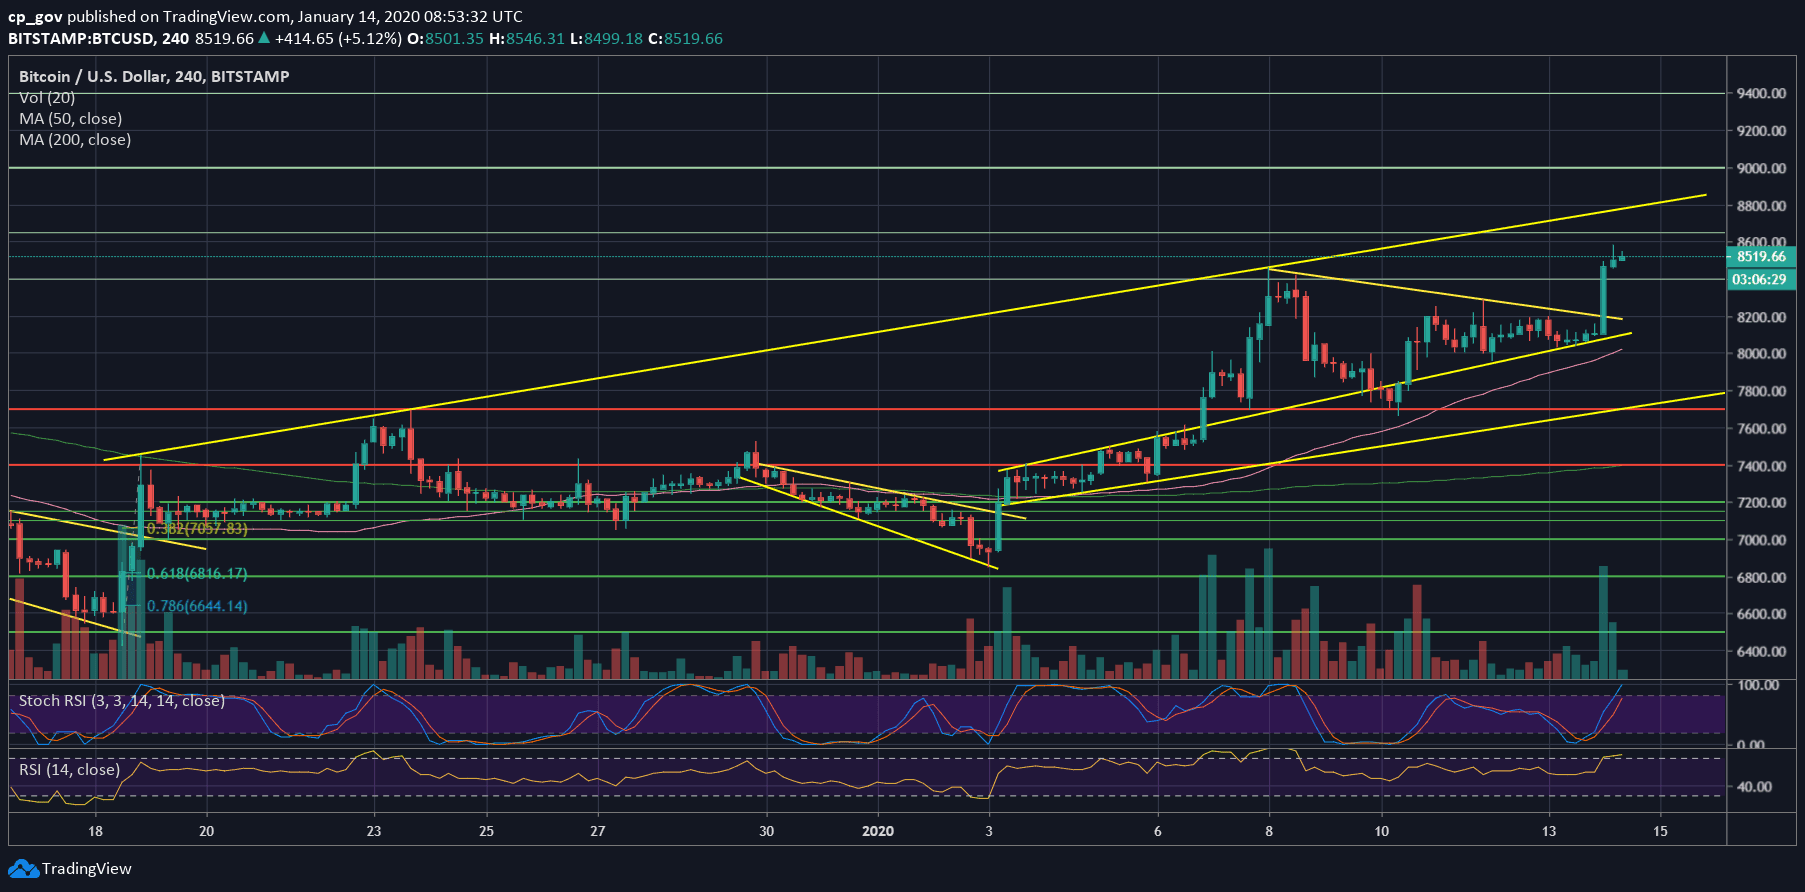
Technically, looking on the 4-hour chart, we can see Bitcoin breaking out from a horizontal triangle, roughly at $8200. The quick surge brought Bitcoin to the resistance level of $8600 (as mentioned here before).
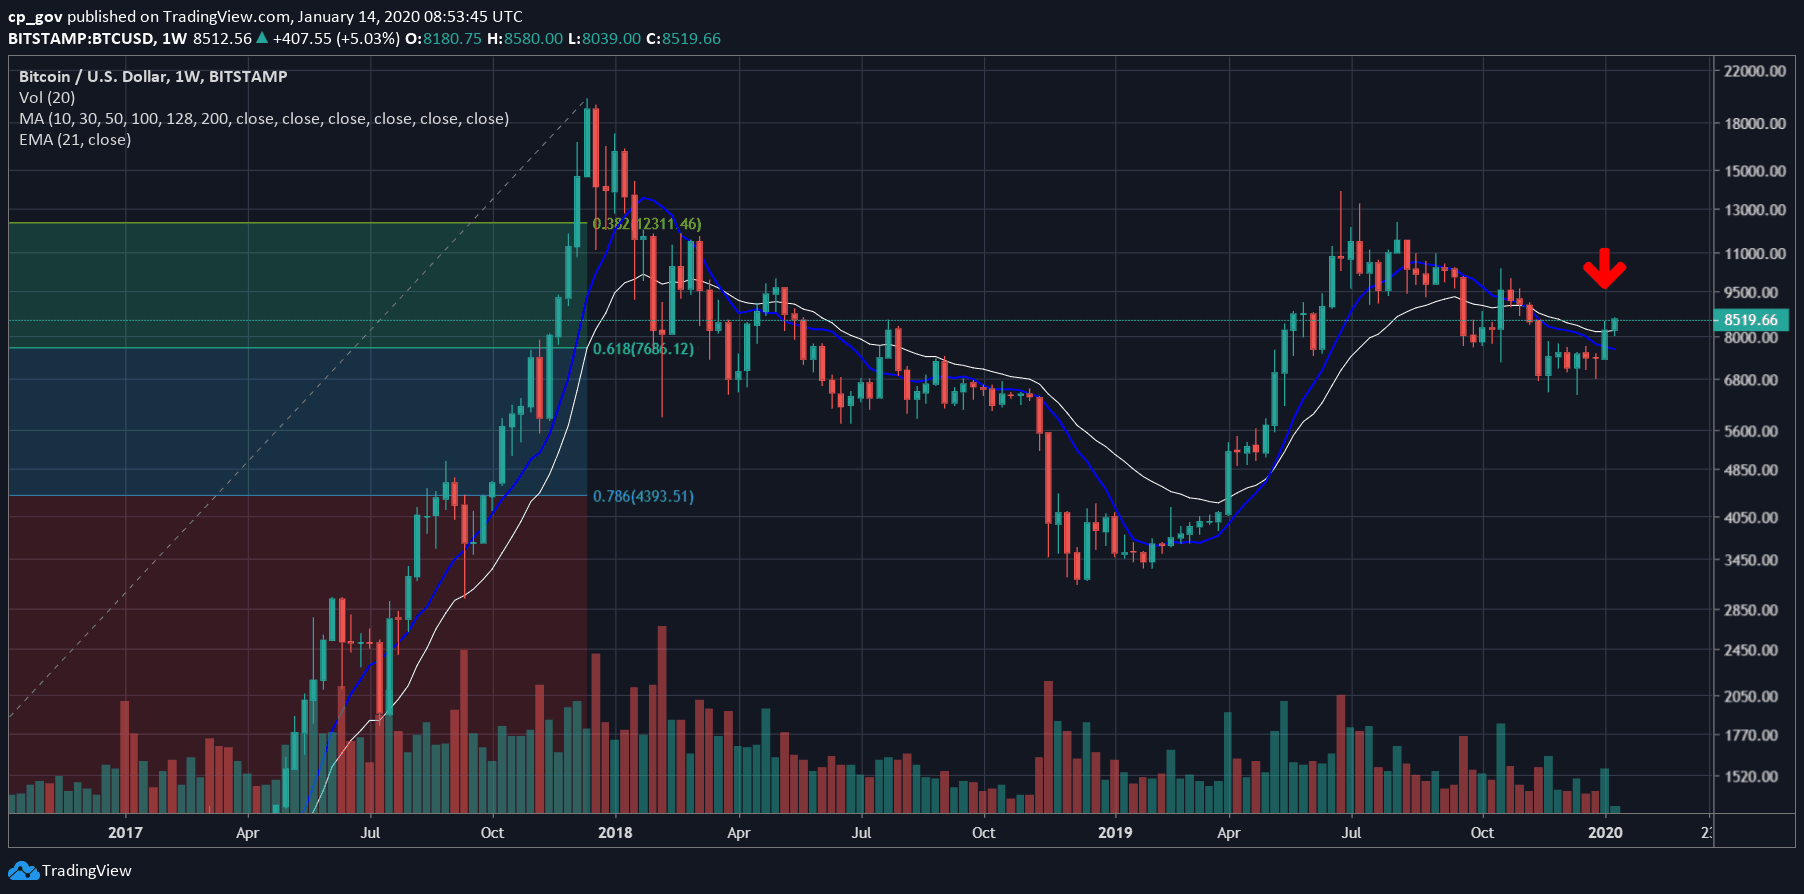
On the bigger picture, the last weekly close was accurately on the 21-moving average line, which was at $8180. However, the new week so far looks promising, forming a decent green candle above the MA-21 line.
This is the highest level of Bitcoin in almost 2-month, since the 17 of November.
Total Market Cap: $226.7 billion
Bitcoin Market Cap: $154.6 billion
BTC Dominance Index: 68.2%
*Data by CoinGecko
Key Levels To Watch & Next Targets
– Support/Resistance levels: As discussed above, the first level of resistance is at $8600. A little above lies $8800 horizontal level, along with the ascending “roof” trend-line on the 4-hour chart.
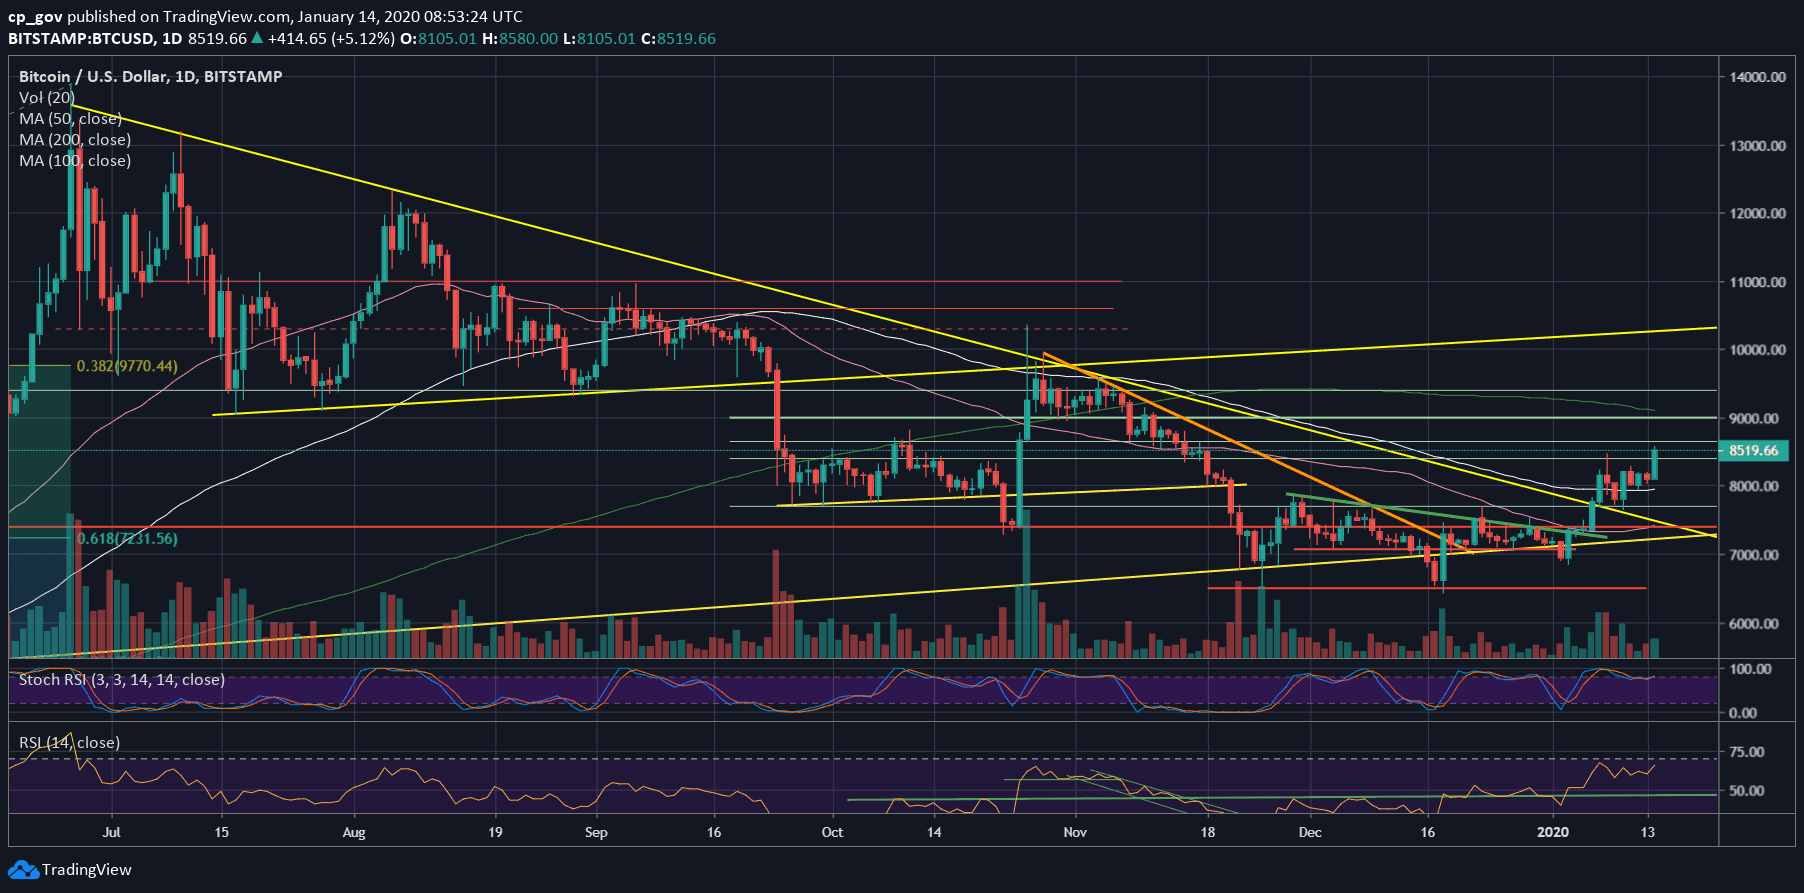
Further above is the $9000 benchmark and the significant 200-days moving average line which is marked by light green on the following daily chart. The next level is $9400.
From below, Bitcoin marks $8400 as the first resistance turned support level. Further below lies $8200, which is the 21-moving average line, along with past resistance (the breakout discussed above).
– The RSI Indicator: Despite the gains, there is a bit of bearish divergence starting to form on the RSI. It will be interesting to see the outcome here.
Following the crossover, the Stochastic RSI oscillator hadn’t entered the neutral territory, and so far so good regarding the oscillator.
– Trading volume: Decent amounts of volume followed the recent surge. It’s real; the bulls are here.
BTC/USD BitStamp 4-Hour Chart
BTC/USD BitStamp 1-Day Chart
BTC/USD BitStamp Weekly Chart
Disclaimer: Information found on CryptoPotato is those of writers quoted. It does not represent the opinions of CryptoPotato on whether to buy, sell, or hold any investments. You are advised to conduct your own research before making any investment decisions. Use provided information at your own risk. See Disclaimer for more information.
Cryptocurrency charts by TradingView.
Technical analysis tools by Coinigy.
You might also like:
The post appeared first on CryptoPotato


