
Bitcoin doesn’t like to stay so long at one spot. The more it does remain, the sharper the next move will be.
Let’s start from the macro-level: the last Wednesday saw Bitcoin’s huge price move of about a $1000 gain in just 12 hours – surging from below $6500 straight into the $7400 resistance (the marked MA-100 on the 4-hour chart).
A price drop followed this major move down to $7000, and then a stabilization inside a tight range, like Bitcoin was used to do in the past month.
This time the range is so tight, roughly between $7100 to $7200. The range is holding the price for the past three days.
In the micro-level, we can identify a bullish triangle on the 4-hour timeframe; but anything can change. The only thing we predict is a huge move which is likely to take place in the next 1-2 days, probably as the CME and CBOE start their trading week on Monday morning US time.
Total Market Cap: $191 billion
Bitcoin Market Cap: $130.7 billion
BTC Dominance Index: 68.3%
*Data by CoinGecko
Key Levels to Watch
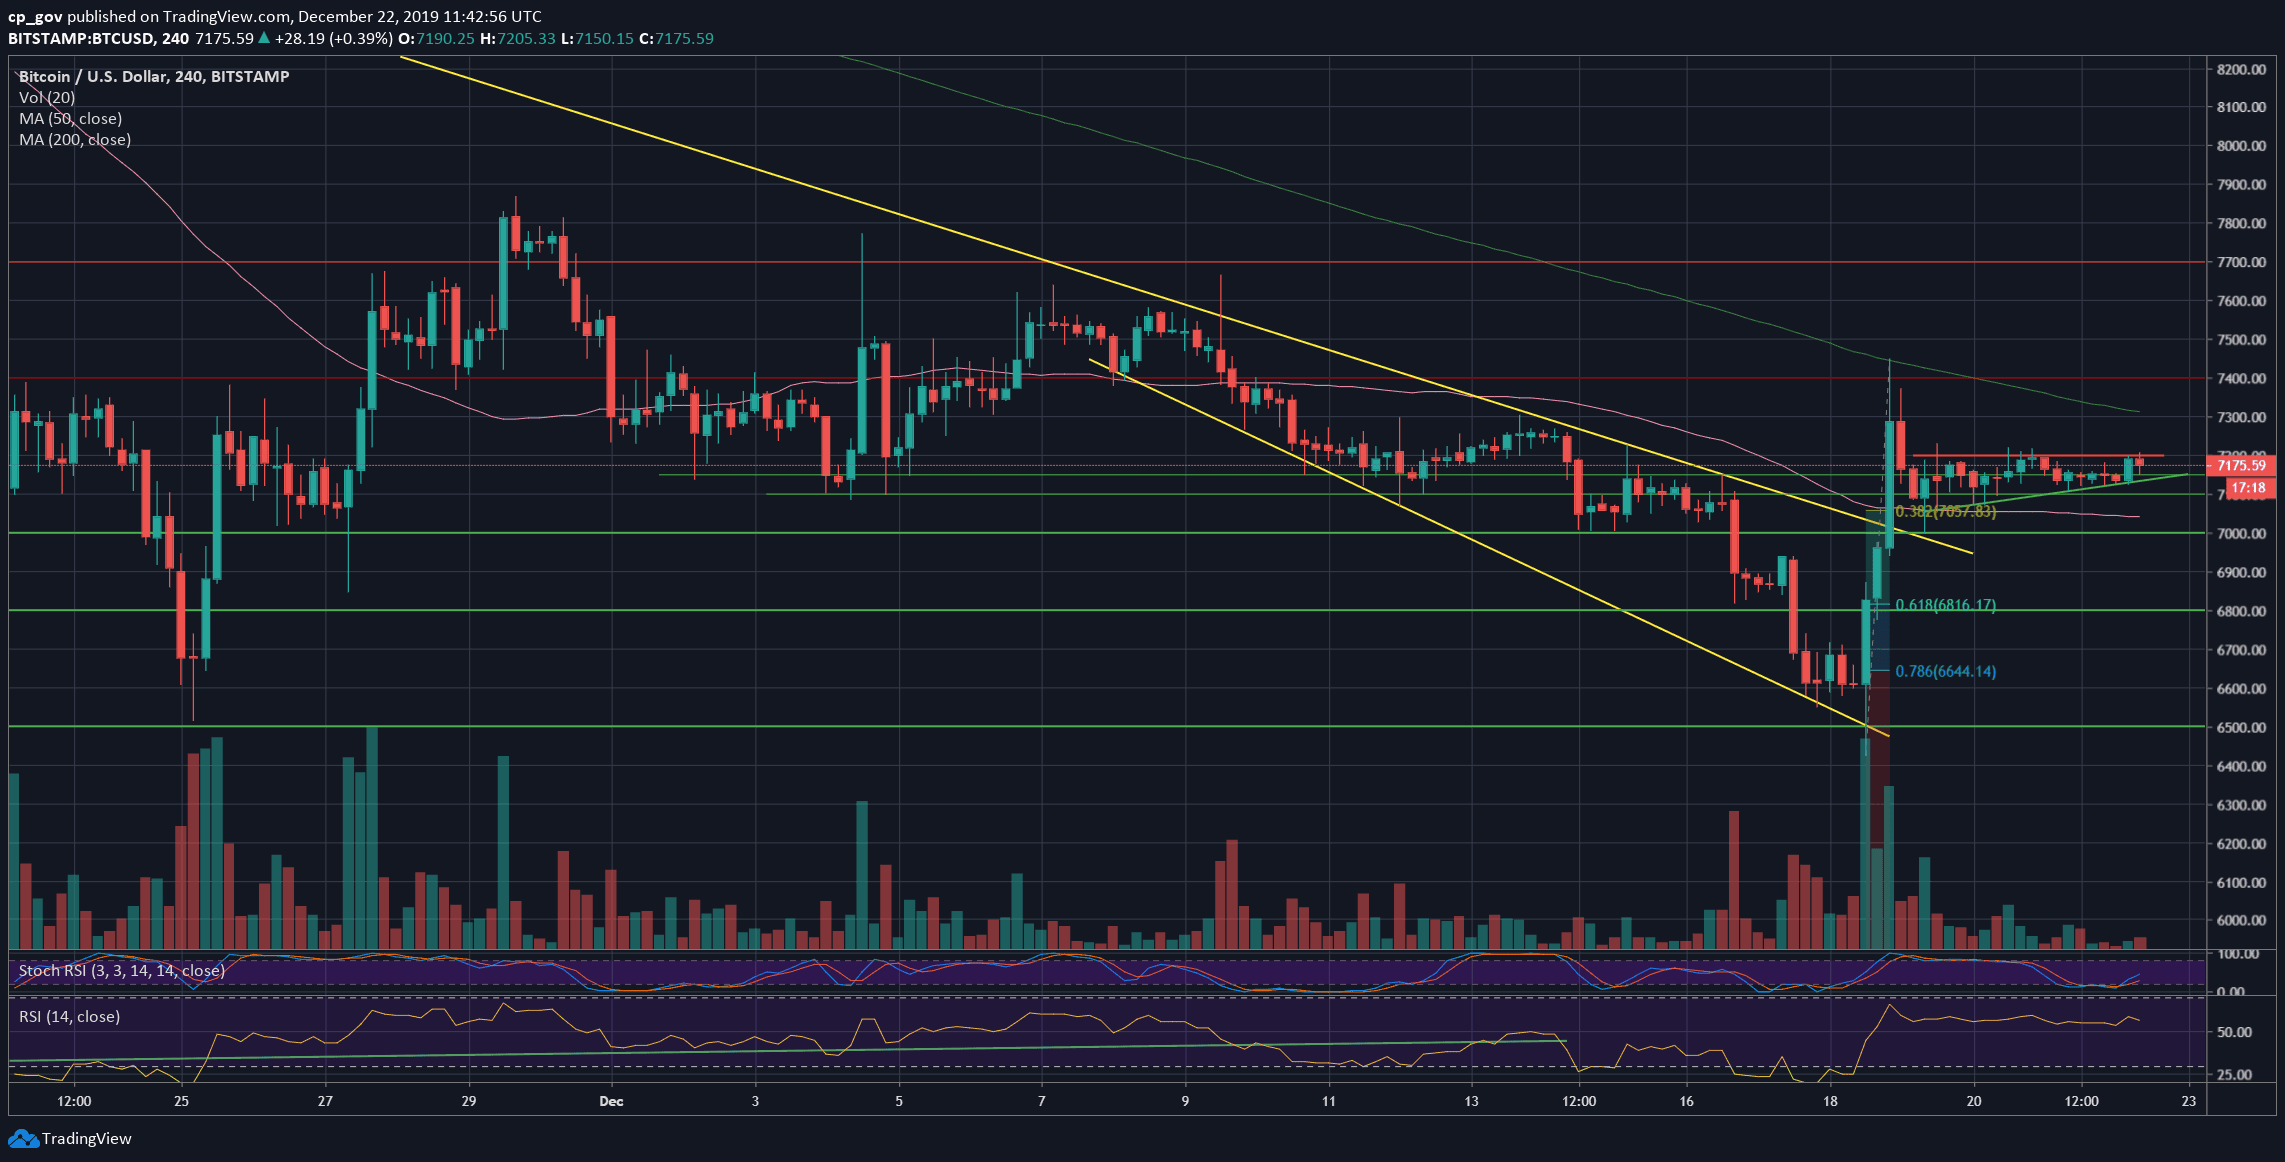
– Support/Resistance: Looking at the following 4-hour chart, we can see that the first resistance level is the top of the mini bullish triangle, at around $7200.
In case Bitcoin does break-up, then the next resistance level should be the $7300 – $7400 zone, which is combined of the weekly high (from Wednesday), the MA-100 line (marked light green on the 4-hour chart), and a significant resistance area from the recent past.
Further above lies the $7700 resistance, before the good-old $8000 resistance.
From below, in case of Bitcoin breaks the triangle formation (as of now around $7145), then the first support level is at $7000 – $7100, along with the MA-50 line (pink) on the 4-hour chart.
Down below lies $6800 (Fib level 61.8% from the recent Wednesday surge), $6650 (78.6% Fib level), and the $6500 area, which is the double bottom and the lowest price Bitcoin saw since May 2019.
– The RSI Indicator: Over the past three days, the RSI indicator is also ‘stuck’ at the 44-45 resistance level. This is a 2-month-old resistance. A decision here will be made whether the RSI will overcome the resistance or get rejected back down.
Despite the neutral RSI, the Stochastic RSI oscillator is about to make a bearish crossover at the overbought territory. This supports a price drop. However, anything can still be changed.
– Trading volume: The trading volume is also anticipating the huge move, as the volume’s declining over the past four days.
BTC/USD BitStamp 4-Hour Chart
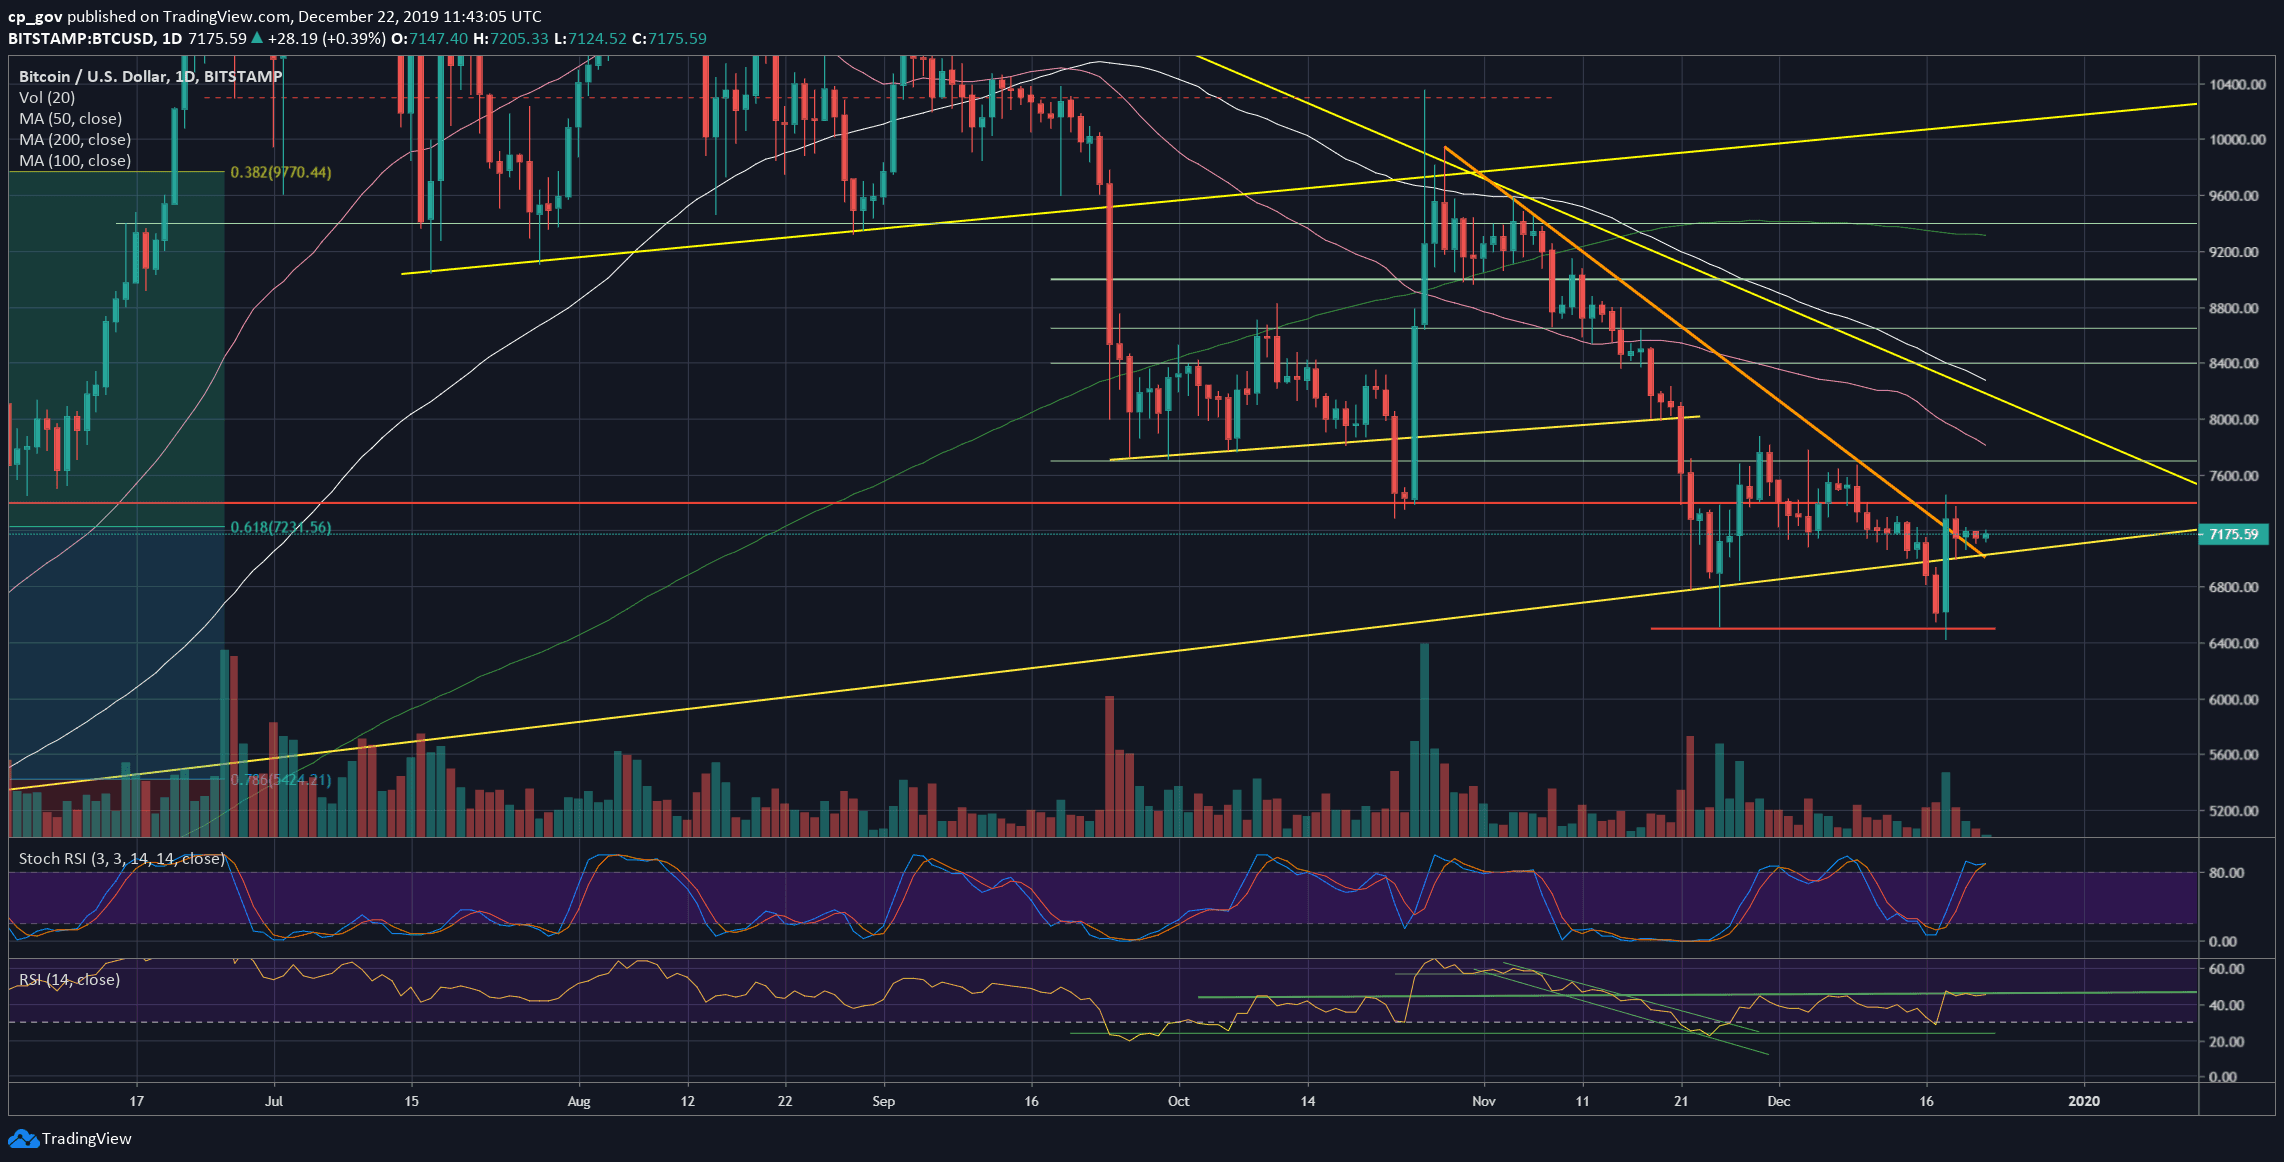
BTC/USD BitStamp 1-Day Chart
Disclaimer: Information found on CryptoPotato is those of writers quoted. It does not represent the opinions of CryptoPotato on whether to buy, sell, or hold any investments. You are advised to conduct your own research before making any investment decisions. Use provided information at your own risk. See Disclaimer for more information.
Cryptocurrency charts by TradingView.
Technical analysis tools by Coinigy.
You might also like:
The post appeared first on CryptoPotato


