
Bitcoin price rallied more than 5% to clear the $7,500 resistance against the US Dollar.The price is now trading in a positive zone and it could rise further above $7,700.There is a short term breakout pattern forming with resistance near $7,590 on the hourly chart of the BTC/USD pair (data feed from Kraken).There could be a short term correction, but the price remains well bid above $7,500 and $7,460.Bitcoin price is showing signs of a bullish continuation above $7,500 against the US Dollar. BTC is likely to continue higher and the bulls seem to be aiming $8,000 this week.Bitcoin Price AnalysisAfter consolidating below the $7,200 resistance, bitcoin started a nice upward move against the US Dollar. BTC surpassed a few key hurdles near $7,300 and $7,400 to start a strong upward move.Moreover, there was a close above the $7,500 resistance and the 100 hourly simple moving average. It opened the doors for more gains and the price rallied above $7,600. A new weekly high is formed near $7,652 and the price is currently consolidating gains.An initial support is near the $7,540 level. Besides, the 23.6% Fib retracement level of the recent surge from the $7,166 low to $7,652 high is near $7,537. If there are more downside, the next stop could be near the $7,460 level (the recent breakout zone).The net major support could be $7,400, and the 50% Fib retracement level of the recent surge from the $7,166 low to $7,652 high. At the moment, there is a short term breakout pattern forming with resistance near $7,590 on the hourly chart of the BTC/USD pair.If there is an upside break above the $7,590 and $7,600 resistance levels, bitcoin is likely to resume its upward move. The next resistance is near the $7,652 high, above which the price could surge towards the $7,800 level.Any further gains will most likely lead the price towards the key $8,000 resistance area, where sellers are likely to take a stand.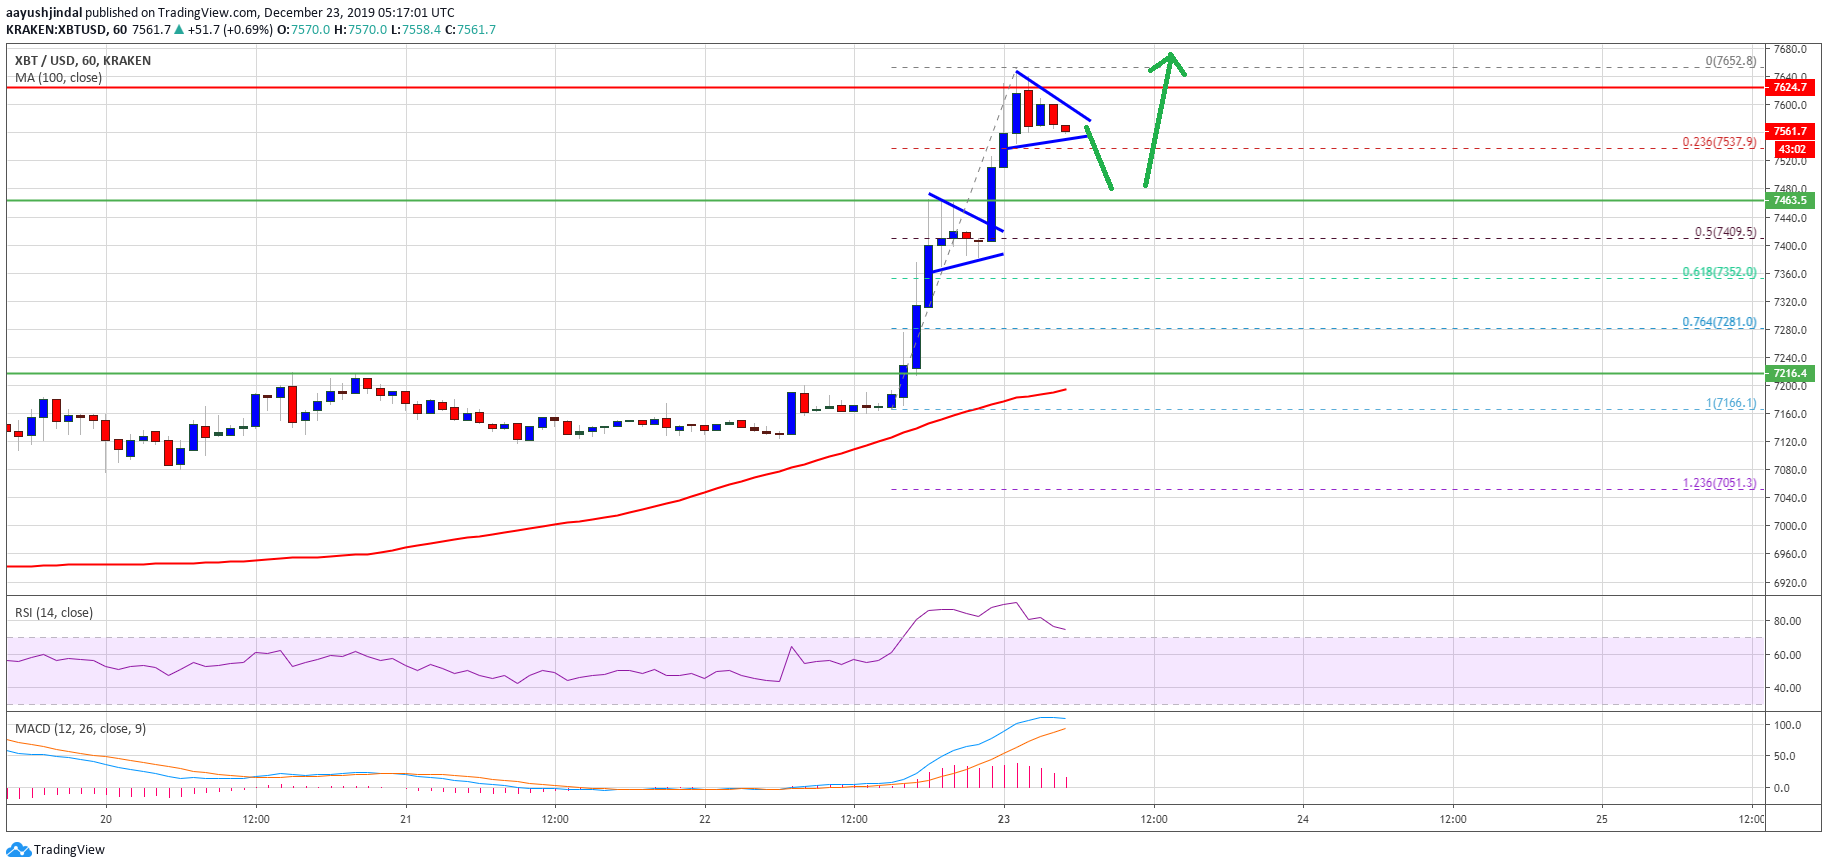 Bitcoin PriceLooking at the chart, bitcoin price is showing a lot of positive signs after the recent rally above $7,500. Therefore, there are high chances of more upsides above the $7,700 and $7,800 levels in the coming sessions unless the price trades below $7,400.Technical indicators:Hourly MACD – The MACD is slowly reducing its bullish slop.Hourly RSI (Relative Strength Index) – The RSI for BTC/USD is currently correcting lower from the overbought zone.Major Support Levels – $7,460 followed by $7,400.Major Resistance Levels – $7,600, $7,650 and $7,800.The post appeared first on NewsBTC


