
Bitcoin‘s pump on 3 January came as a surprise; the pump contributed to BTC shooting from $6,853 to $7,369 in a span of 8 hours. During times like these, there are bound to be many liquidations, many worth hundred-millions.
At press time, the price was staring at the resistance that it failed to breach during an earlier pump [December 29]. Will the price successfully breach this resistance and climb new highs as 2020 starts afresh?
4 Hour Chart
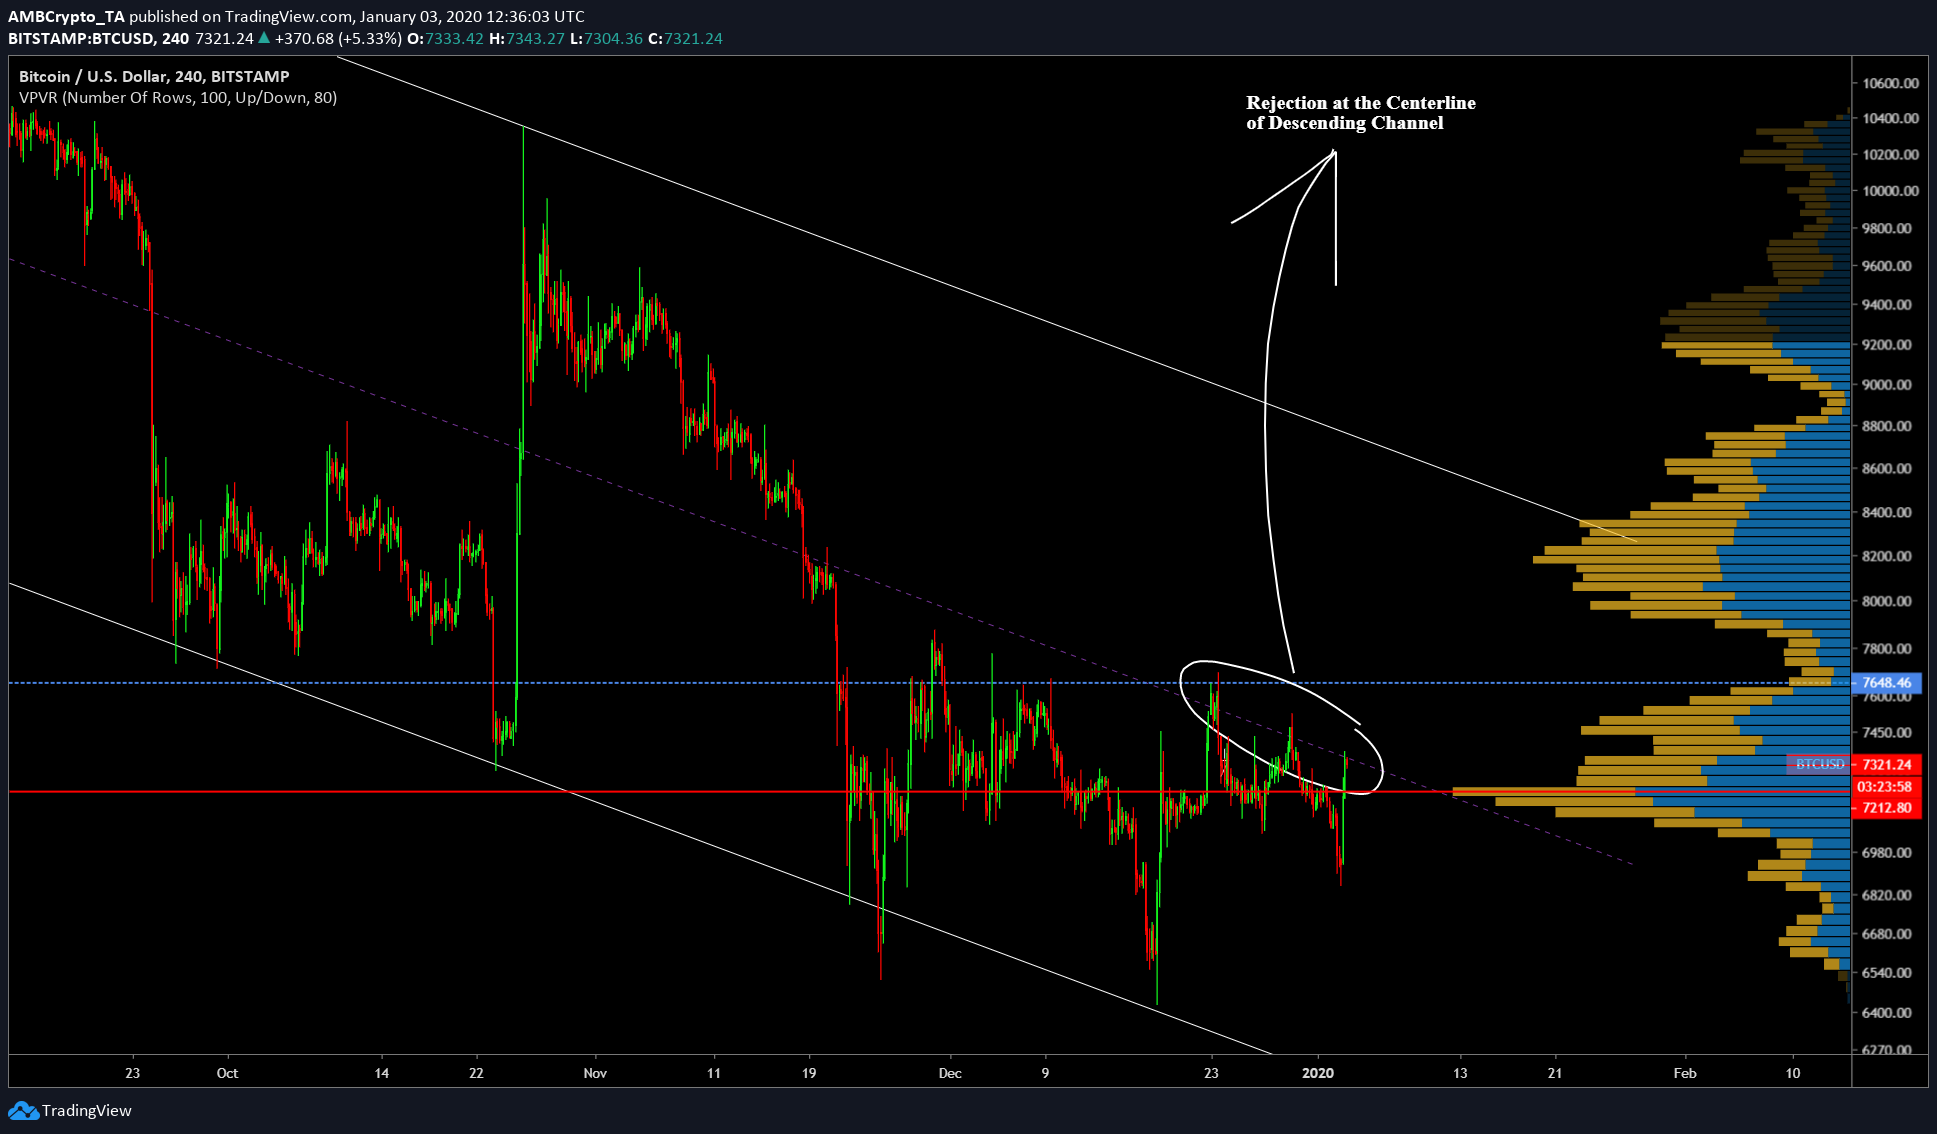
Source: BTC/USD TradingView
As mentioned in the previous article, the price of Bitcoin is consolidating in the parallel channel. Recent pumps have tried to breach the center-line of this channel, but failed. The current pump seems to be running on fumes as there is a tussle between the buyers and sellers at this point.
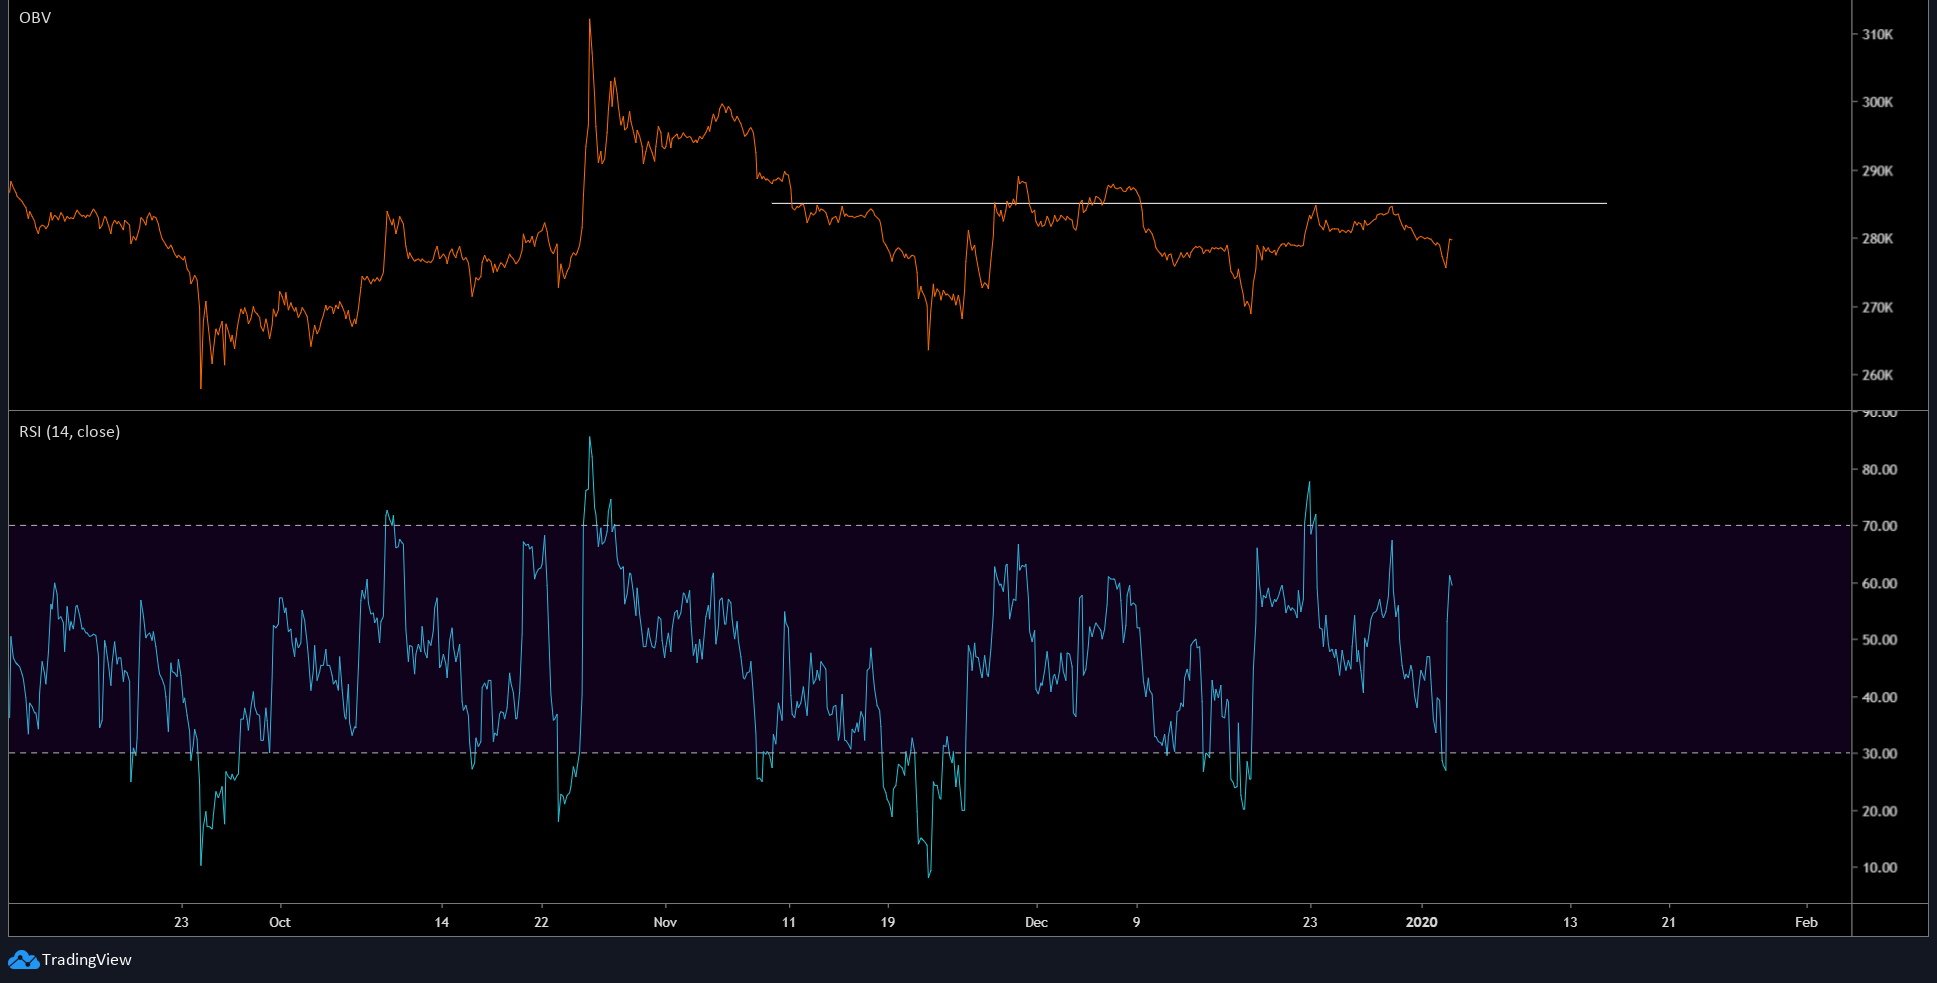
Source: BTC/USD TradingView
Volume is a major factor at play in deciding the direction of the next move. Likewise, the On-Balance Volume for Bitcoin showed a reversal after hitting resistance at $285,000. However, the recent pump has started a small uptick.
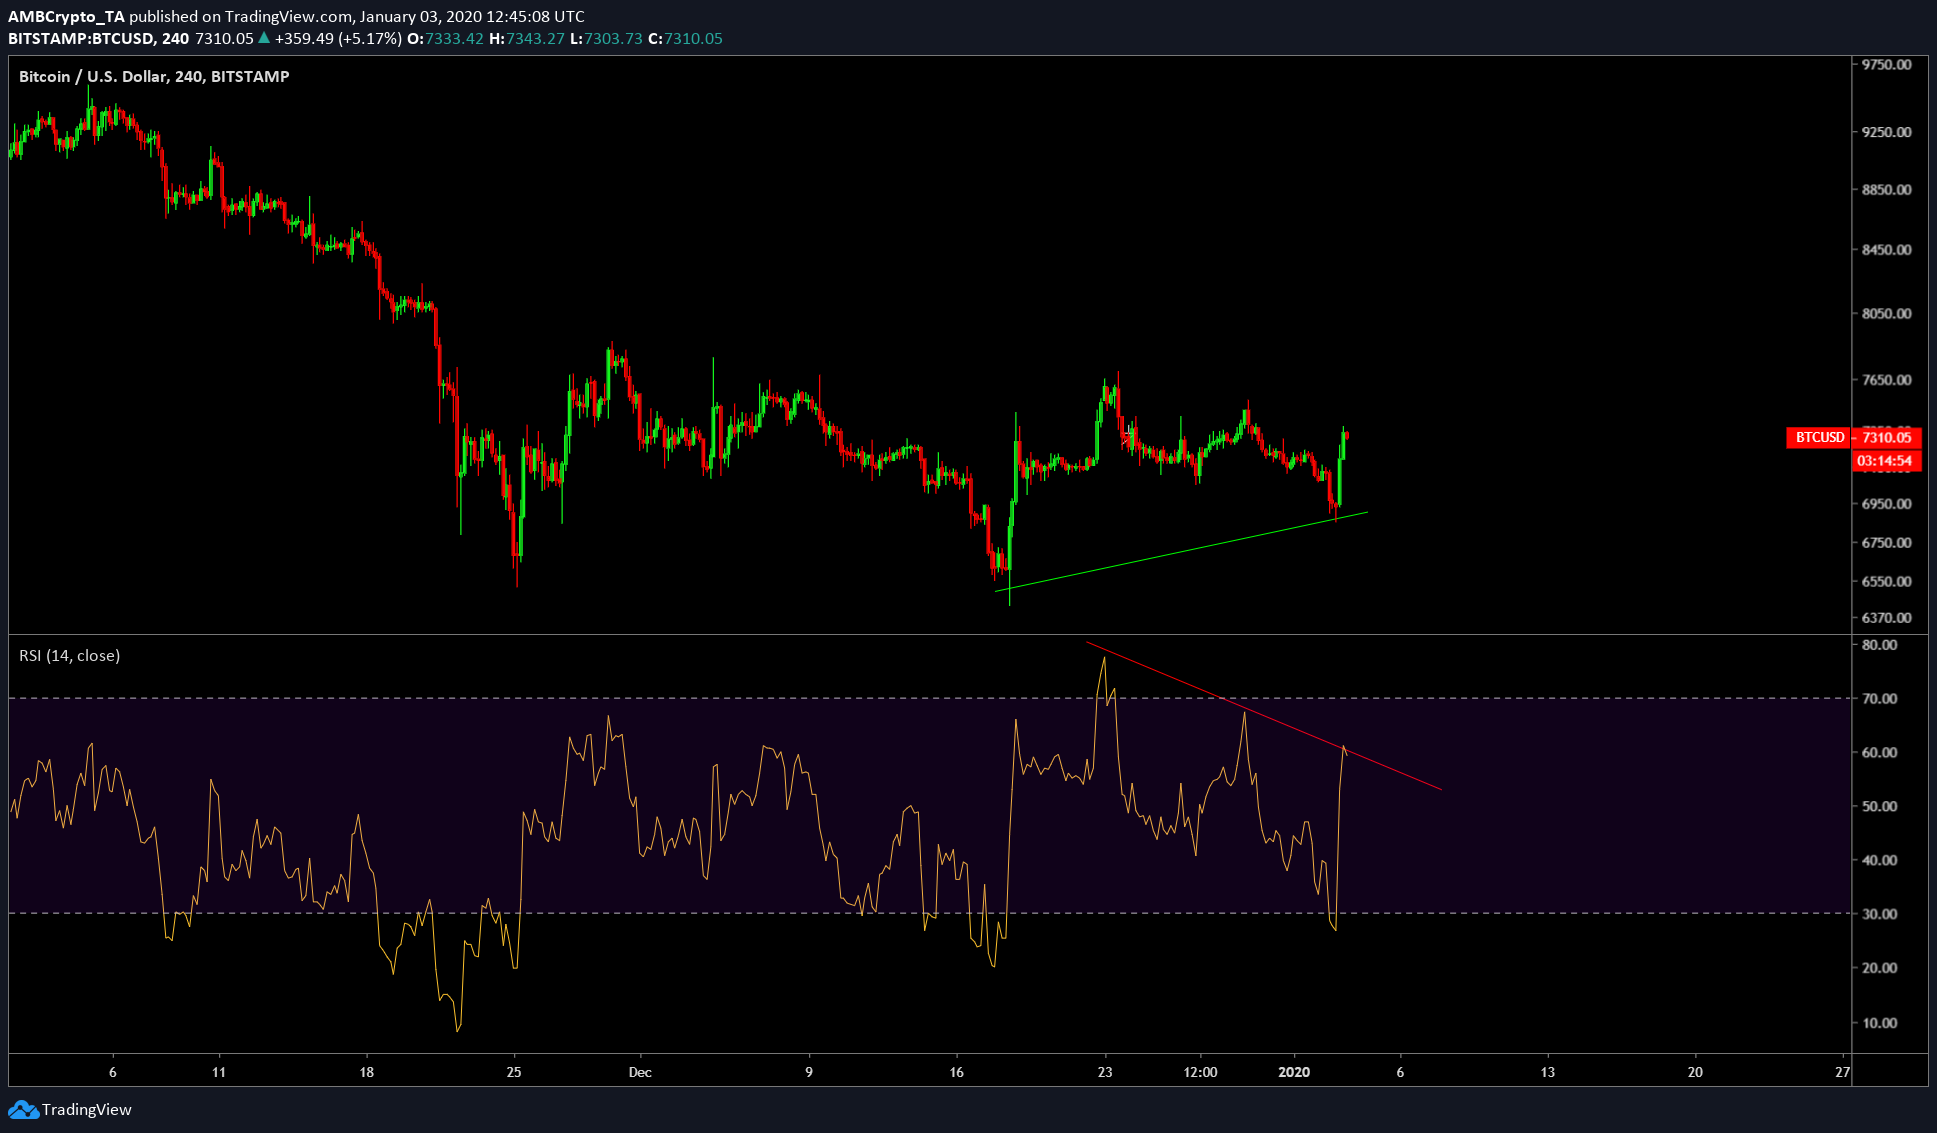
Source: BTC/USD TradingView
Moreover, the RSI for Bitcoin showed a bearish divergence in play, indicating a dip in the near future. This sudden pump has caused the liquidation of $70 million in total.
Daily Chart
The Daily chart for Bitcoin showed a much clearer and larger picture. Today’s Bitcoin pump fit perfectly into the larger scenario and all of them are bearish.
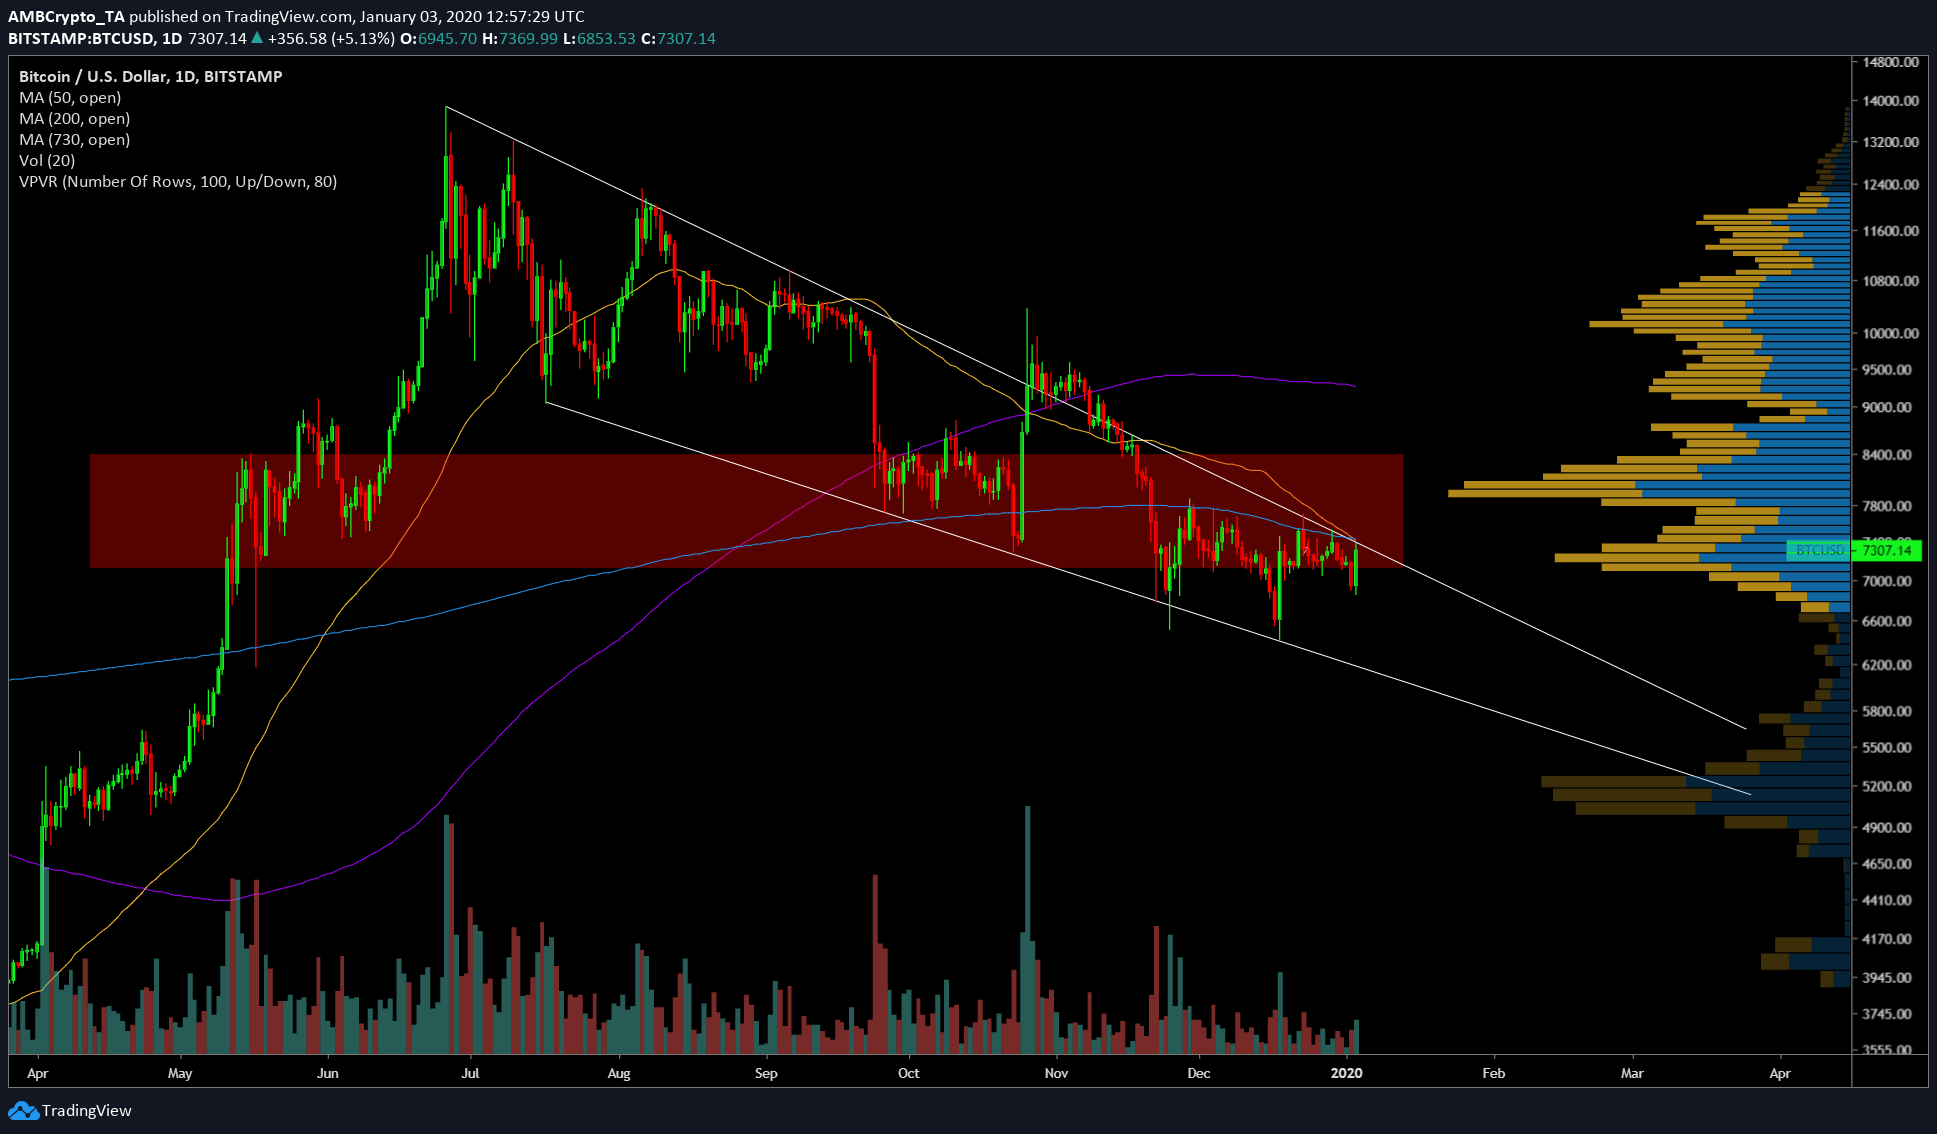
Source: BTC/USD TradingView
- The 50-day MA acting as a resistance
- Resistance from the 2-year aka 730-day MA
- Horizontal resistance zone ranging from $7,123 to $8,390.
All of the above indicate a massive overhead resistance for Bitcoin and crossing this would require massive bullish momentum. It would take something more than the U.S. killing Iran’s top military commander. And, while this event seems to have helped oil prices surge, coincidentally, Bitcoin’s price has also surged.
The only “bright side” for Bitcoin is the formation of a bullish pattern on the daily time frame – Falling Wedge. This wedge, if all the right conditions are met, could break-out to the top causing massive profits.
Conclusion
The short-term target for Bitcoin is the rejection at $7,364 and sideways movement for the next 10 to 12 hours, followed by a dip at $7,120. Further bearish momentum could push the price below $7,000.
The post appeared first on AMBCrypto


