
- Ethereum saw another 4% price increase over the past 24 hours of trading, which caused it to climb back into the resistance at the 200-days EMA.
- Against BTC, ETH dropped beneath the short term ascending triangle but found support at the .382 Fib Retracement.
- Ethereum is still struggling to break the 200-days EMA resistance, which is bolstered by a bearish Fib Retracement. Once it breaks this, it could be heading toward $185.
Key Support & Resistance Levels
Support: $165, $158, $145, $133.50.
Resistance: $174, $181, $186, $193.50.
Support: 0.019 BTC, 0.0188 BTC, 0.0185 BTC, 0.0181 BTC.
Resistance: 0.0195 BTC, 0.020 BTC, 0.0204 BTC.
ETH/USD: ETH Pushes Toward 200-days EMA and Stalls At Bearish .5 Fib Retracement
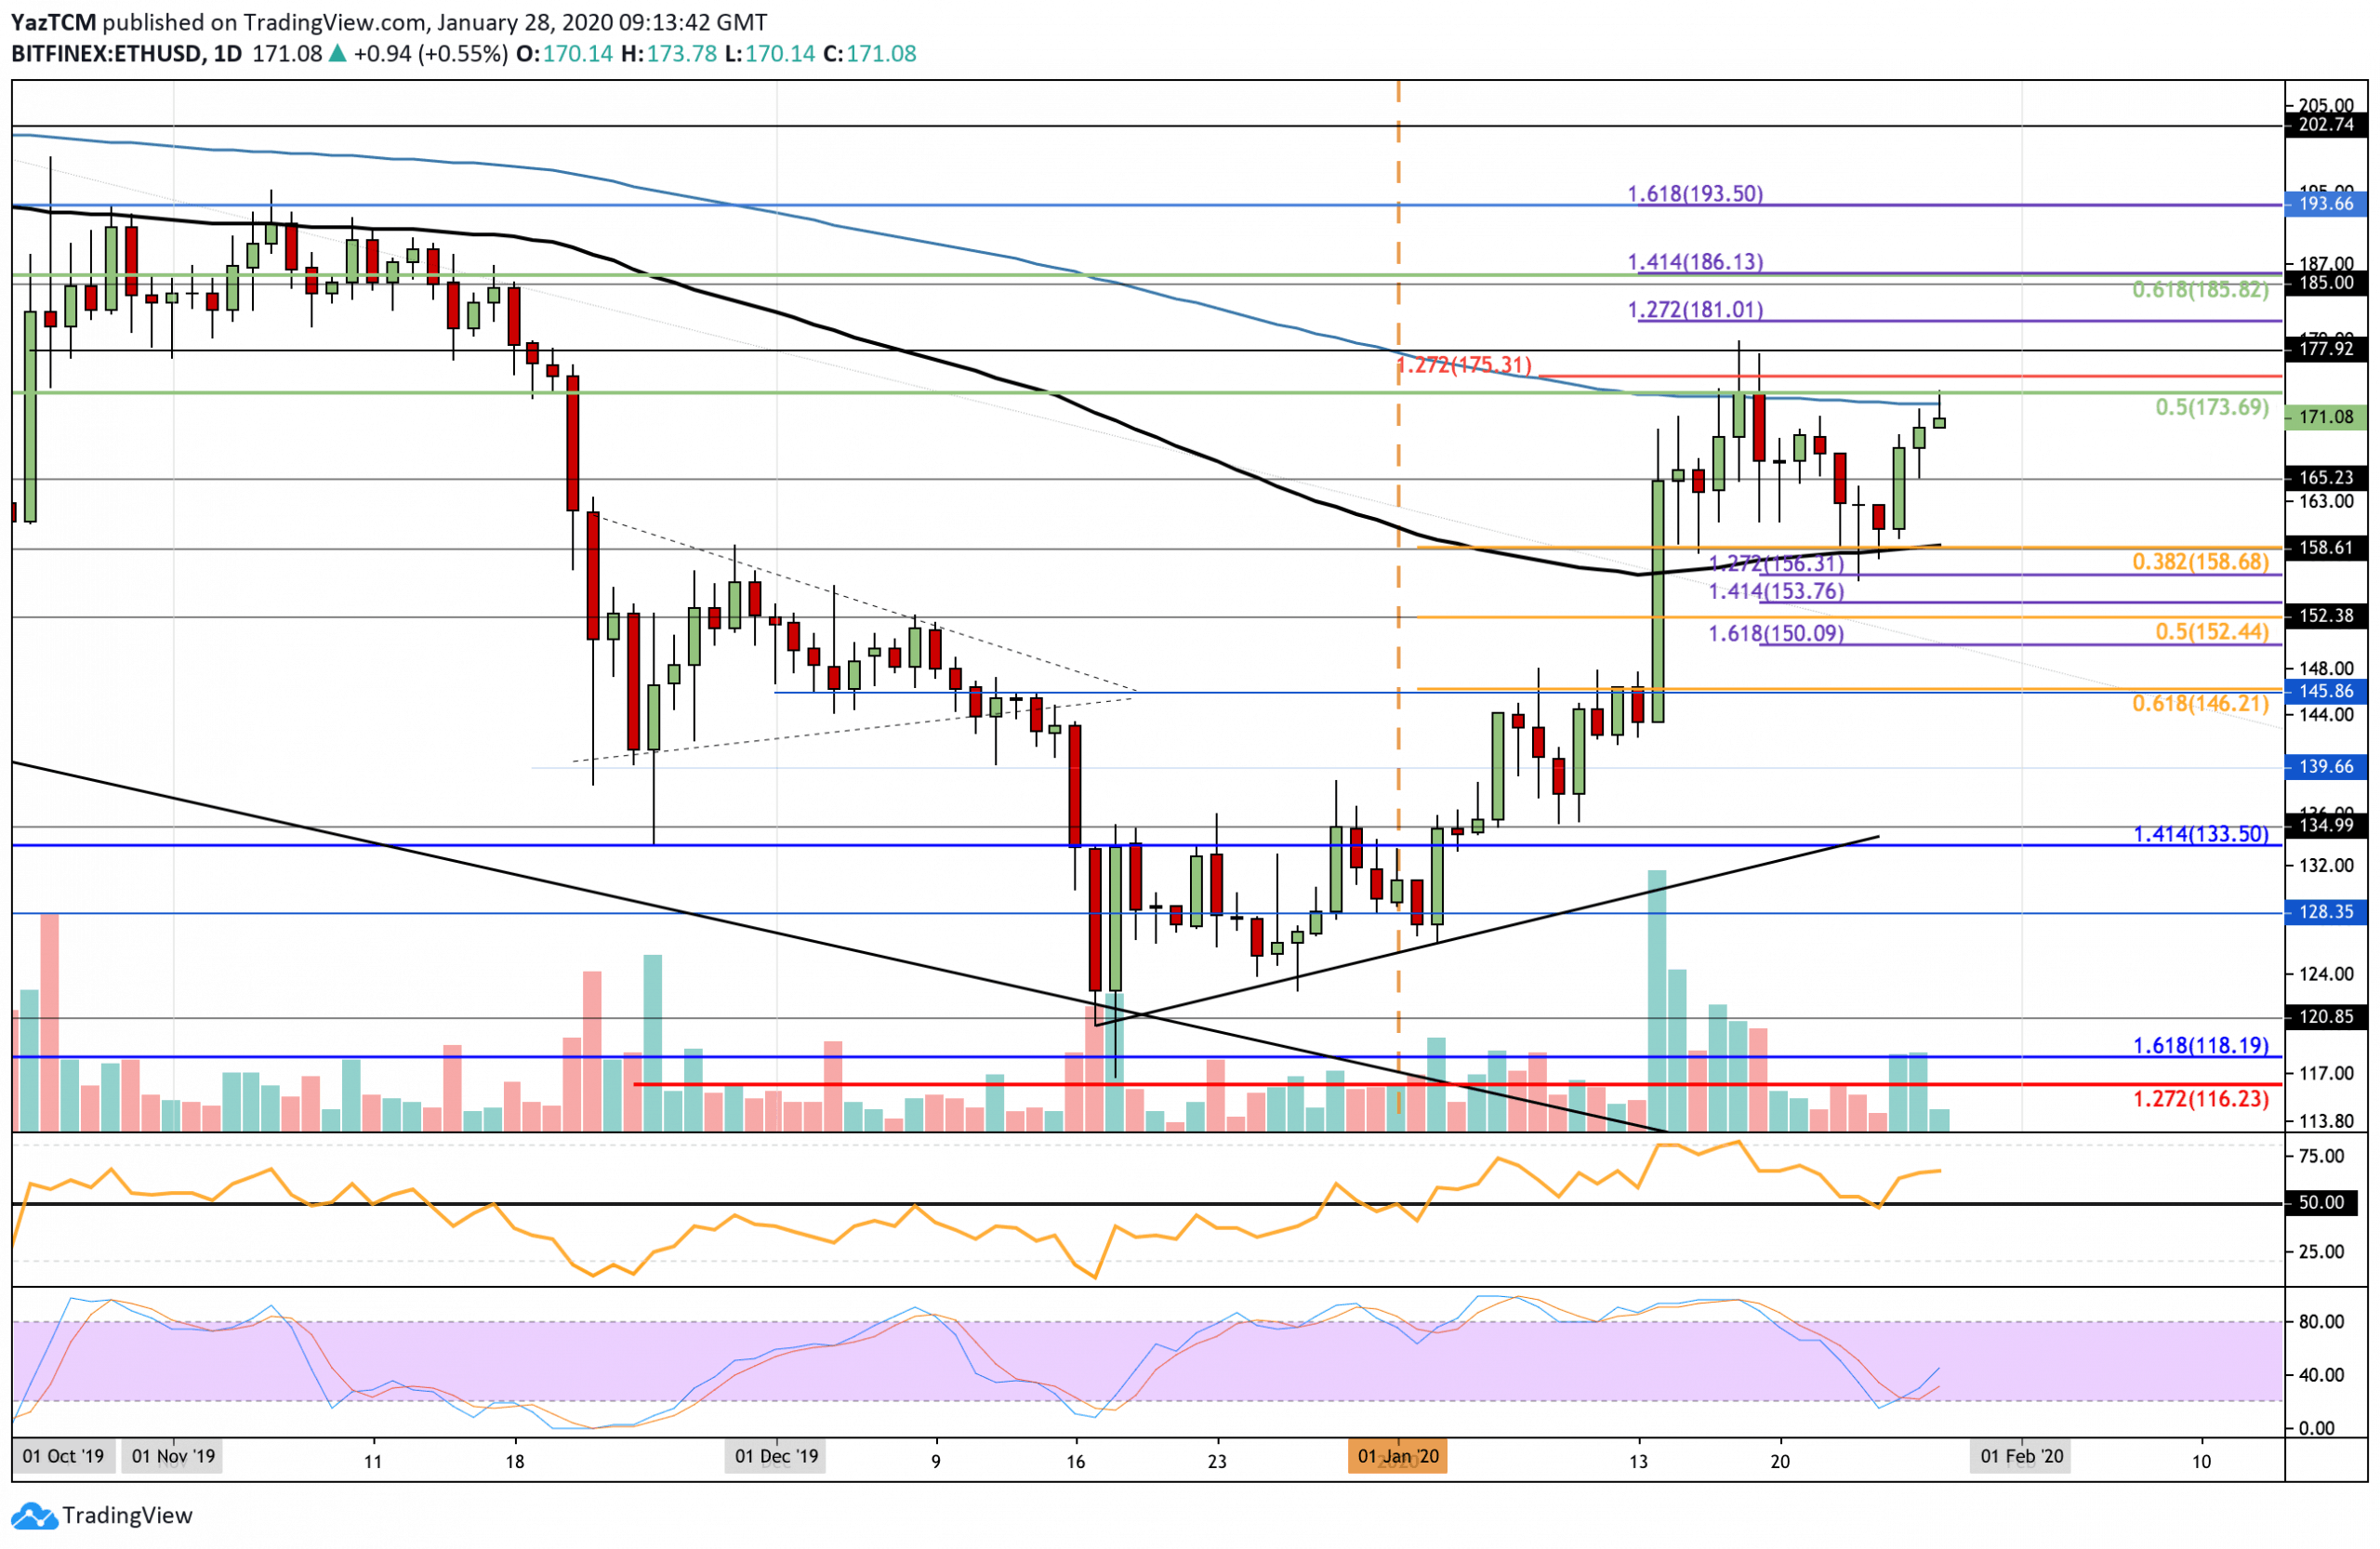
Since our last analysis, ETH went higher above the support at $165 to meet the resistance at the bearish .5 Fibonacci Retracement level at $173.70. The 200-days EMA also adds to the level of resistance in this area as it hovers at $172.50. If Ethereum breaks this line, it could be clear to rise toward the $185 level.
Ethereum still is trading within a bullish trend. However, it still must break the resistance at $173.70 for a medium termed bull run to form. If ETH were to drop back beneath the support at $158, it would turn neutral with a further drop beneath $133.50 turning the market bearish.
Ethereum Short Term Price Prediction
If the bulls manage to crack $173.70 (bearish .5 Fib Retracement & 200-days EMA), the next 2 levels of resistance lie at $178 and $181 (1.272 Fib Extension). Beyond this, resistance lies at $186 (bearish .618 Fib Retracement) and $193.50. On the other hand, if the sellers push the market lower, support can be expected at $165 and $168.70 (short term .382 Fib Retracement & 100-days EMA). Beneath this, support lies at $156, $152.44 (.5 Fib Retracement), and $150.
The RSI continued to bounce higher after rebounding from the 50 level, which shows the bulls remain in charge of the market momentum. Additionally, the bullish crossover signal from the Stochastic RSI has continued to develop as the moving averages expand away from each other. If they can continue to increase, the bullish pressure within the market could bring the price above the 200-days EMA resistance.
ETH/BTC: ETH Breaks Beneath Ascending Triangle Formation
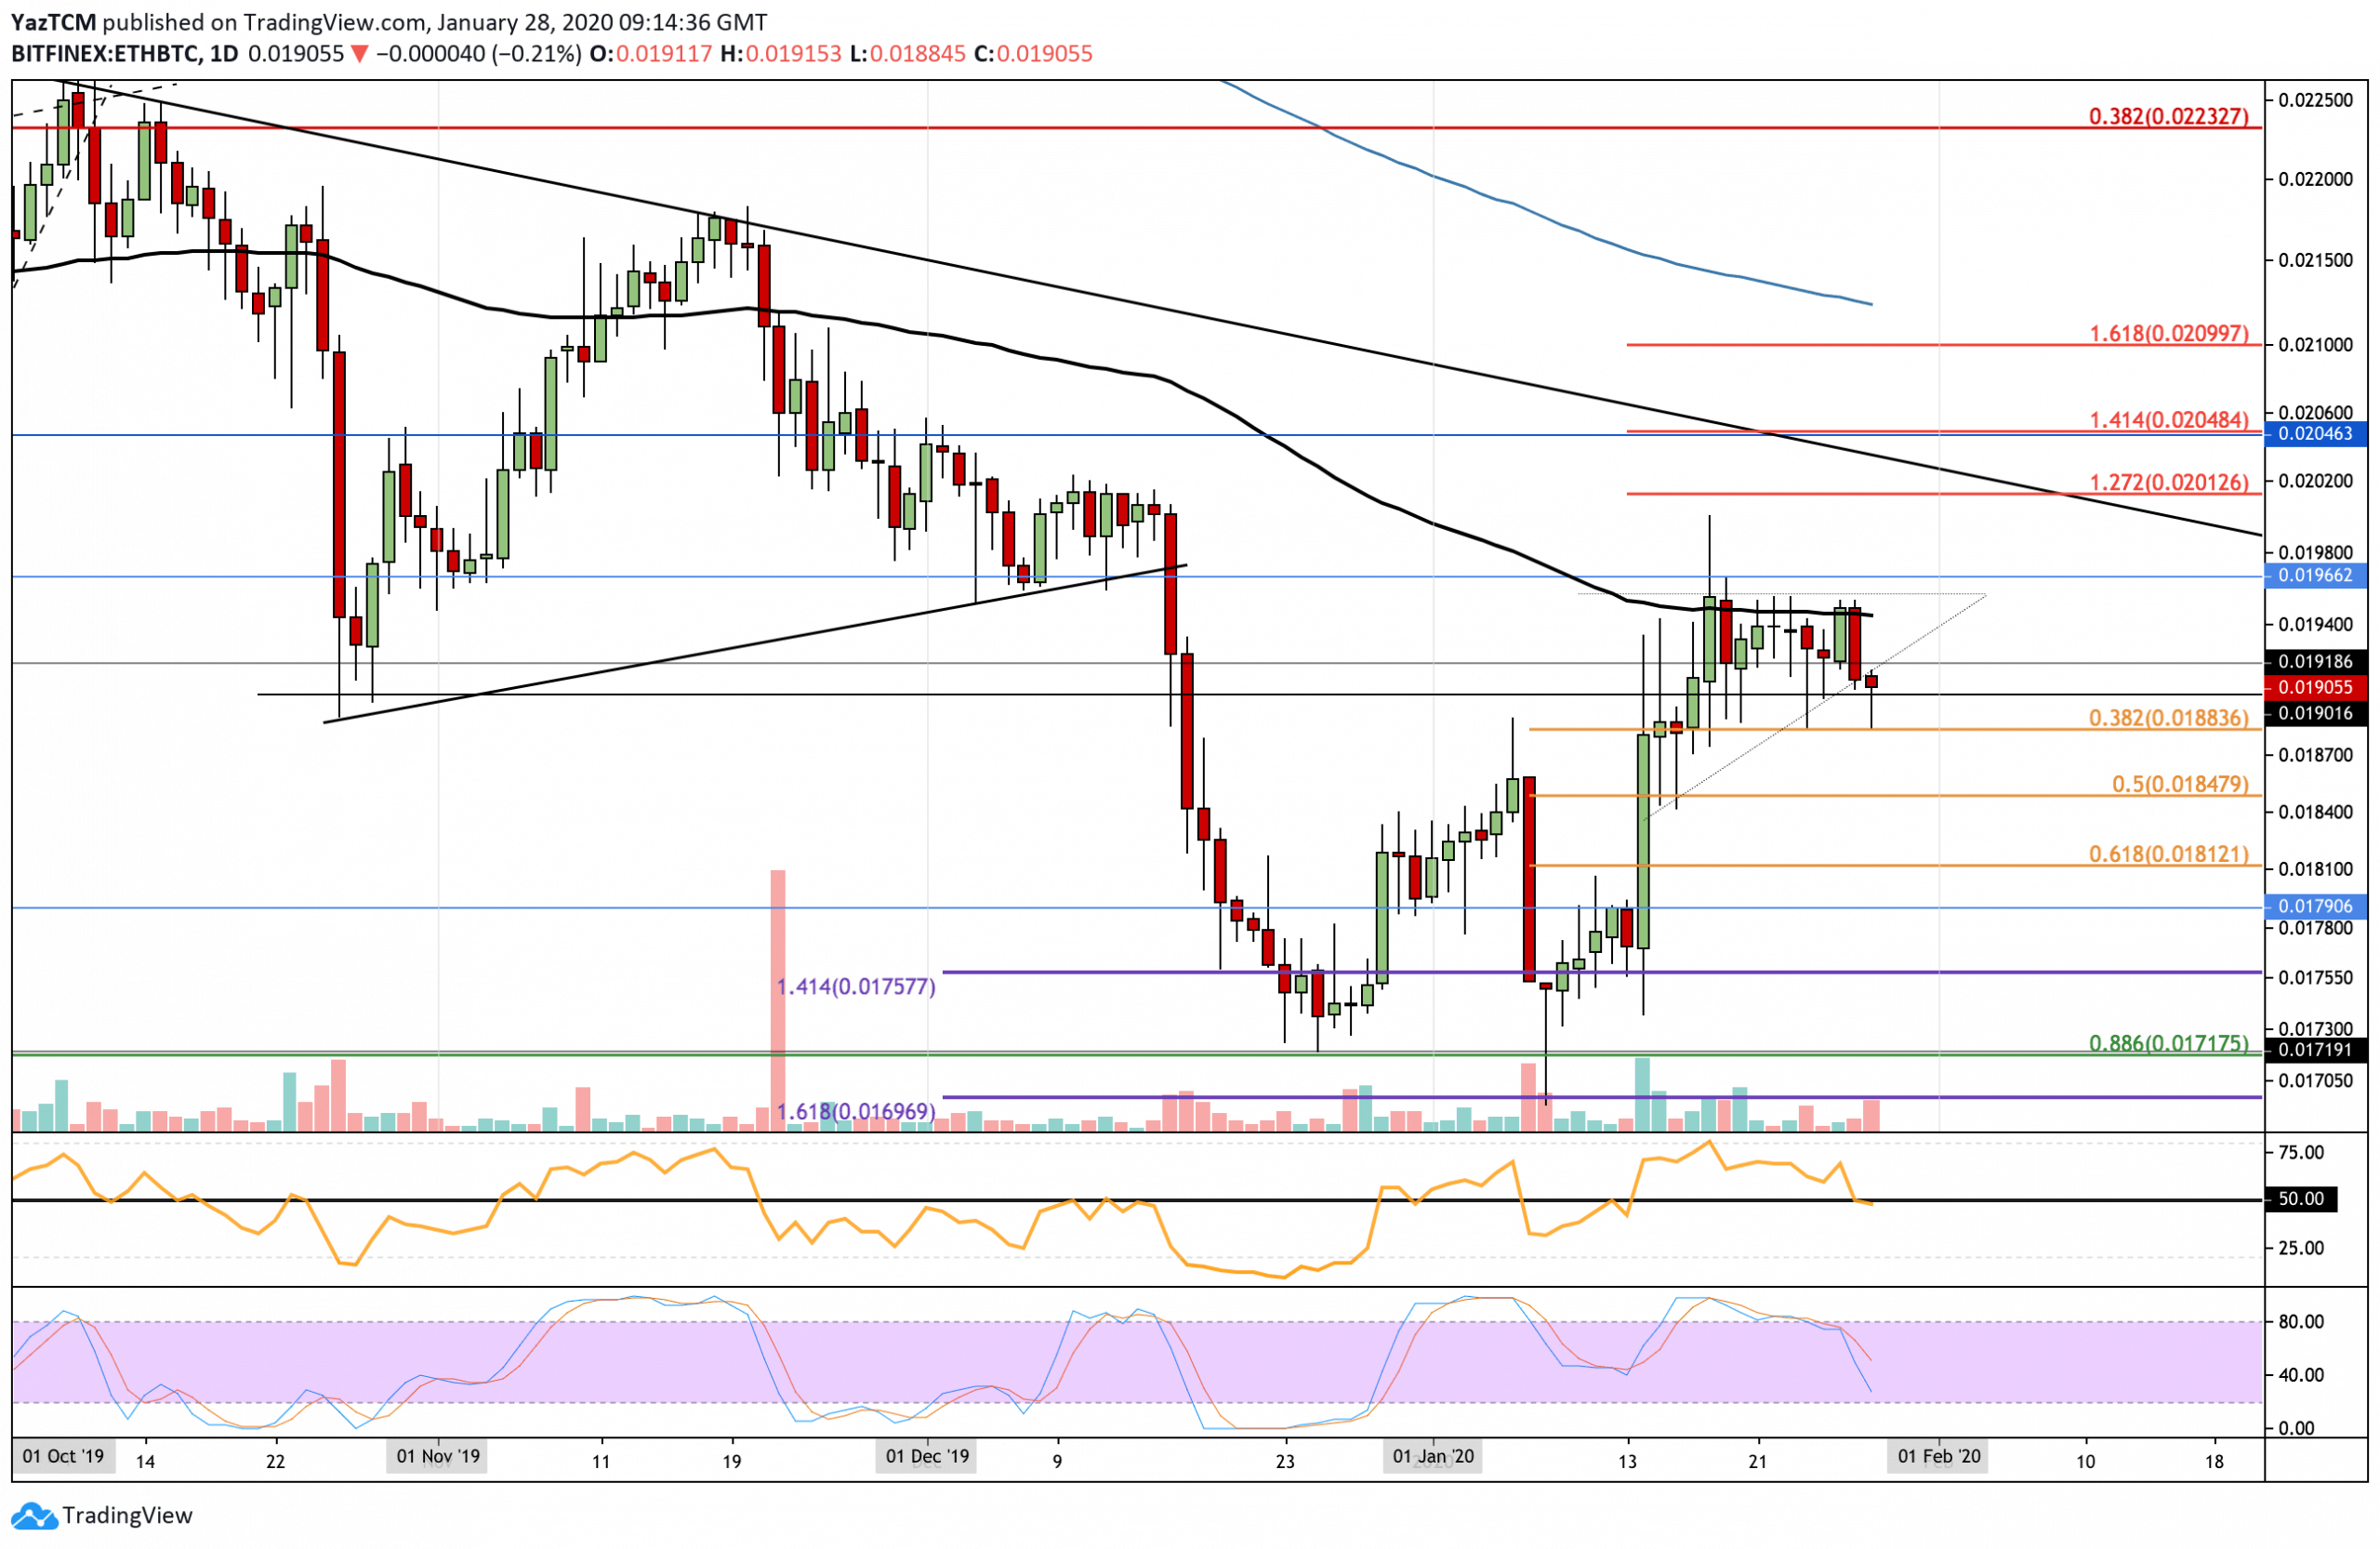
Against Bitcoin, ETH broke beneath the ascending triangle pattern that it was trading within, leading it to drop back into the short term .382 Fibonacci Retracement support at 0.0188 BTC. It rebounded pretty aggressively from this support, causing it to rise back above the 0.019 BTC level again.
Ethereum remains neutral against Bitcoin. However, if it were to drop further lower and break beneath the support at 0.0185 BTC, it would establish a short term bearish trend. To turn bullish, it must rise and break above the resistance at the 100-days EMA and the 0.0195 BTC level.
Ethereum Short Term Price Prediction
If the sellers resume their downward pressure, the first level of strong support lies directly at 0.0188 BTC (.382 Fib Retracement). Beneath this, additional support lies at 0.0185 BTC (.5 Fib Retracement) and 0.0181 BTC (.618 Fib Retracement). On the other hand, if the bulls continue with this rebound and break 0.0192 BTC, the first level of strong resistance lies at 0.0195 BTC (100-days EMA). Above this, resistance lies at 0.0201 BTC and 0.0204 BTC, which is provided by the 1.272 and 1.414 Fib Extensions, respectively.
The RSI has now dropped slightly beneath the 50 level, which is a worrying sign for the bulls. If the RSI closes beneath 50, then ETH will retest the support at 0.0188 BTC and will most likely head further beneath it. The Stochastic RSI has expanded from the bearish crossover signal, which indicates the bears are beginning to strongly dictate the momentum.
Disclaimer: Information found on CryptoPotato is those of writers quoted. It does not represent the opinions of CryptoPotato on whether to buy, sell, or hold any investments. You are advised to conduct your own research before making any investment decisions. Use provided information at your own risk. See Disclaimer for more information.
Cryptocurrency charts by TradingView.
Technical analysis tools by Coinigy.
The post appeared first on CryptoPotato


 Tokens: Report")