
Since Bitcoin topped in June, mainstream haters of cryptocurrencies and related technologies, such as Peter Schiff and Nouriel Roubini, have asserted that BTC is in an “echo bubble.” While many have laughed off this sentiment as pure delusion, the charts may be telling a different story.Related Reading: Bitcoin CME Futures Gaps Are Filled With 95% Certainty, But Trading Them Is RiskyWill Bitcoin Fall to $3,000 Again?An analyst going by James, whose work NewsBTC has covered previously, recently argued that Bitcoin’s current price trajectory is looking “amazingly similar” to how the cryptocurrency was trading in May and June of 2018, which was in the middle of the strong downturn that took BTC to $3,000.He noted that in both cases, Bitcoin was rejected by horizontal resistance at $9,500, the price has found itself stuck between $7,800 and $5,700, and the RSI has entered into a “bear market zone.”Should history repeat, Bitcoin may find itself heading back under $6,000 again, then $5,000, and maybe even under $4,000.Amazingly similar spot we find ourselves in compared to May/June 2018.If history were to repeat… pic.twitter.com/rSbtPWhpFl— James (@coinzada) December 8, 2019Related Reading: Crypto Tidbits: Deutsche Bank Gives Nod to Bitcoin, EOS to Host Social Media, France Digital CurrencyWhy Analysts Say the Bottom is inJames’ analysis accentuates that the bottom may not yet be in, though an array of analysts have begged to differ, not agreeing with the sentiment that more pain is likely.FilbFilb, a pseudonymous cryptocurrency trader that called the mean reversion move to the low-$3,000s in September of 2018, recently posited that the bottom is in. In the latest installment of his “Decentrader” newsletter. In it, he laid out a confluence of signs on Bitcoin’s chart, procured through the use of technical analysis.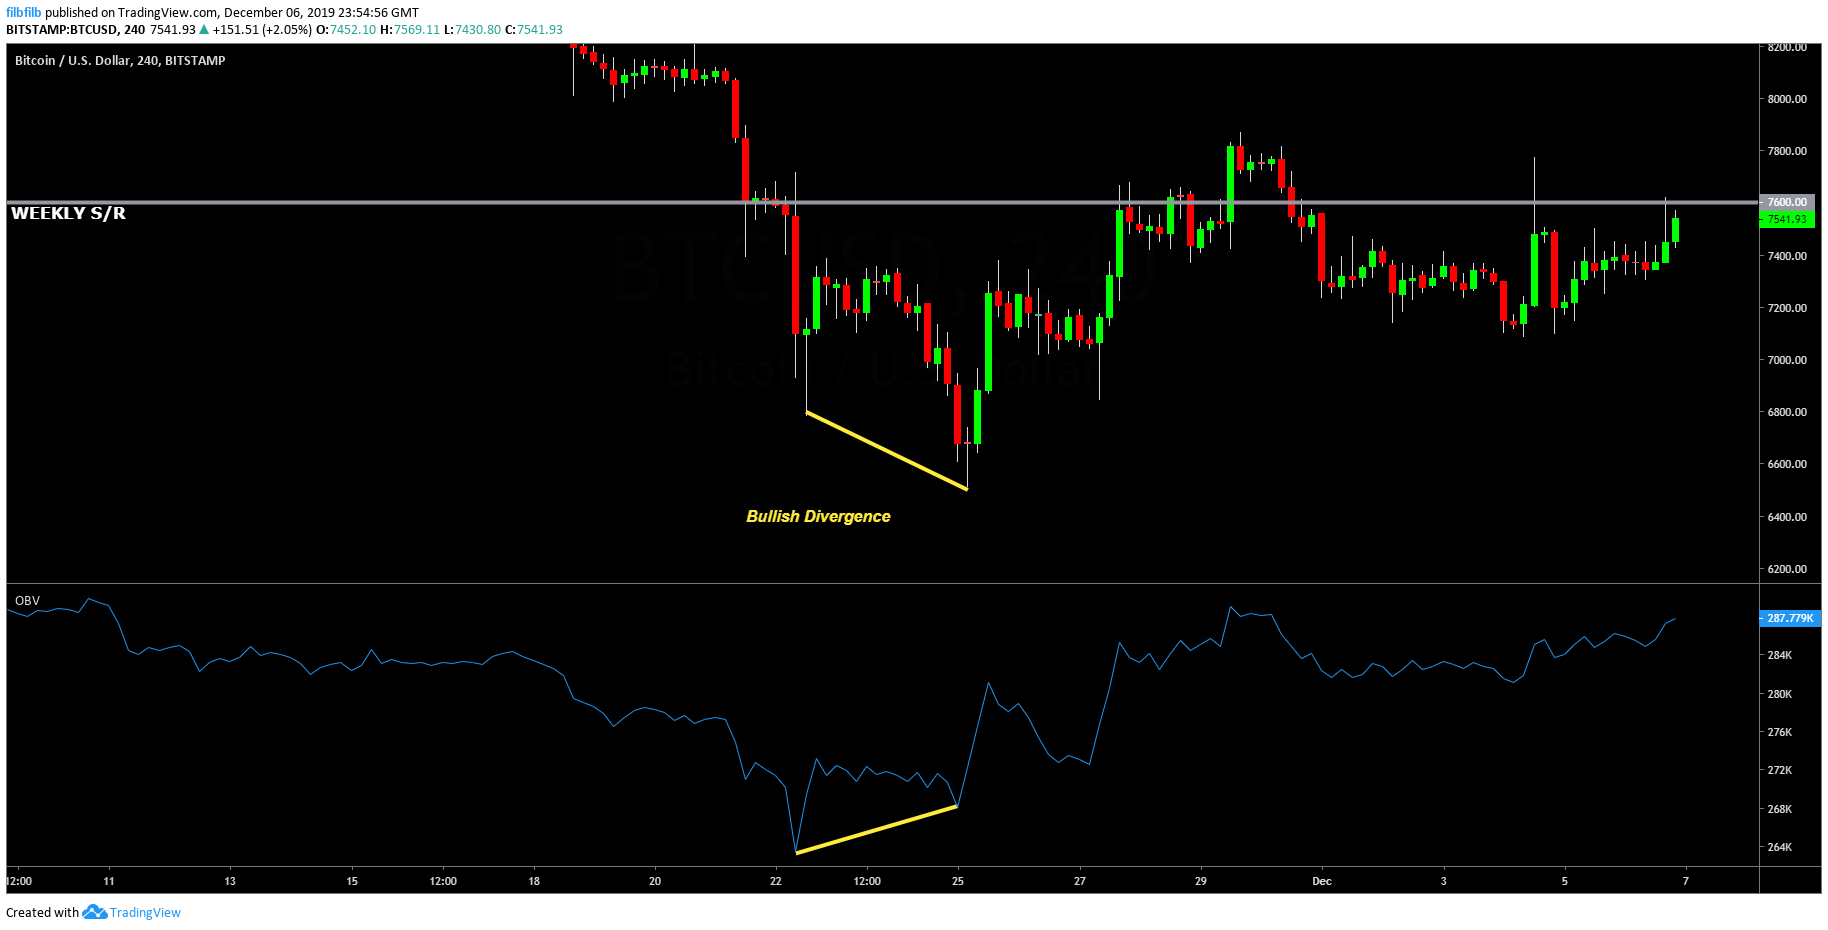 Firstly, the analyst looked to the fact that Bitcoin bounced off the “miner’s bottom,” the price at which the average cryptocurrency breaks even when mining BTC. This is notable as the crypto market bottomed when Bitcoin interacted with the miner’s bottom in December 2018. That’s not to mention that the price chart printed an area of so-called bullish divergences at the $6,500 level.The post appeared first on NewsBTC


