
- EOS saw a slight increase of 5.25% over the past 24, and it now trades at $2.42.
- The cryptocurrency is trading sideways against BTC within a 6-month old symmetrical triangle.
- EOS has been climbing the rankings as it reaches the 7th position with a $2.28 billion market cap.
Key Support & Resistance Levels
EOS/USD
Support: $2.16, $2.05, $1.80.
Resistance: $2.64, $3.00, $3.15.
EOS/BTC:
Support: 0.000332 BTC, 0.000316 BTC, 0.00030 BTC.
Resistance: 0.00036 BTC, 0.00038 BTC, 0.0004 BTC.
EOS/USD: Finds Support At 2019 Lows
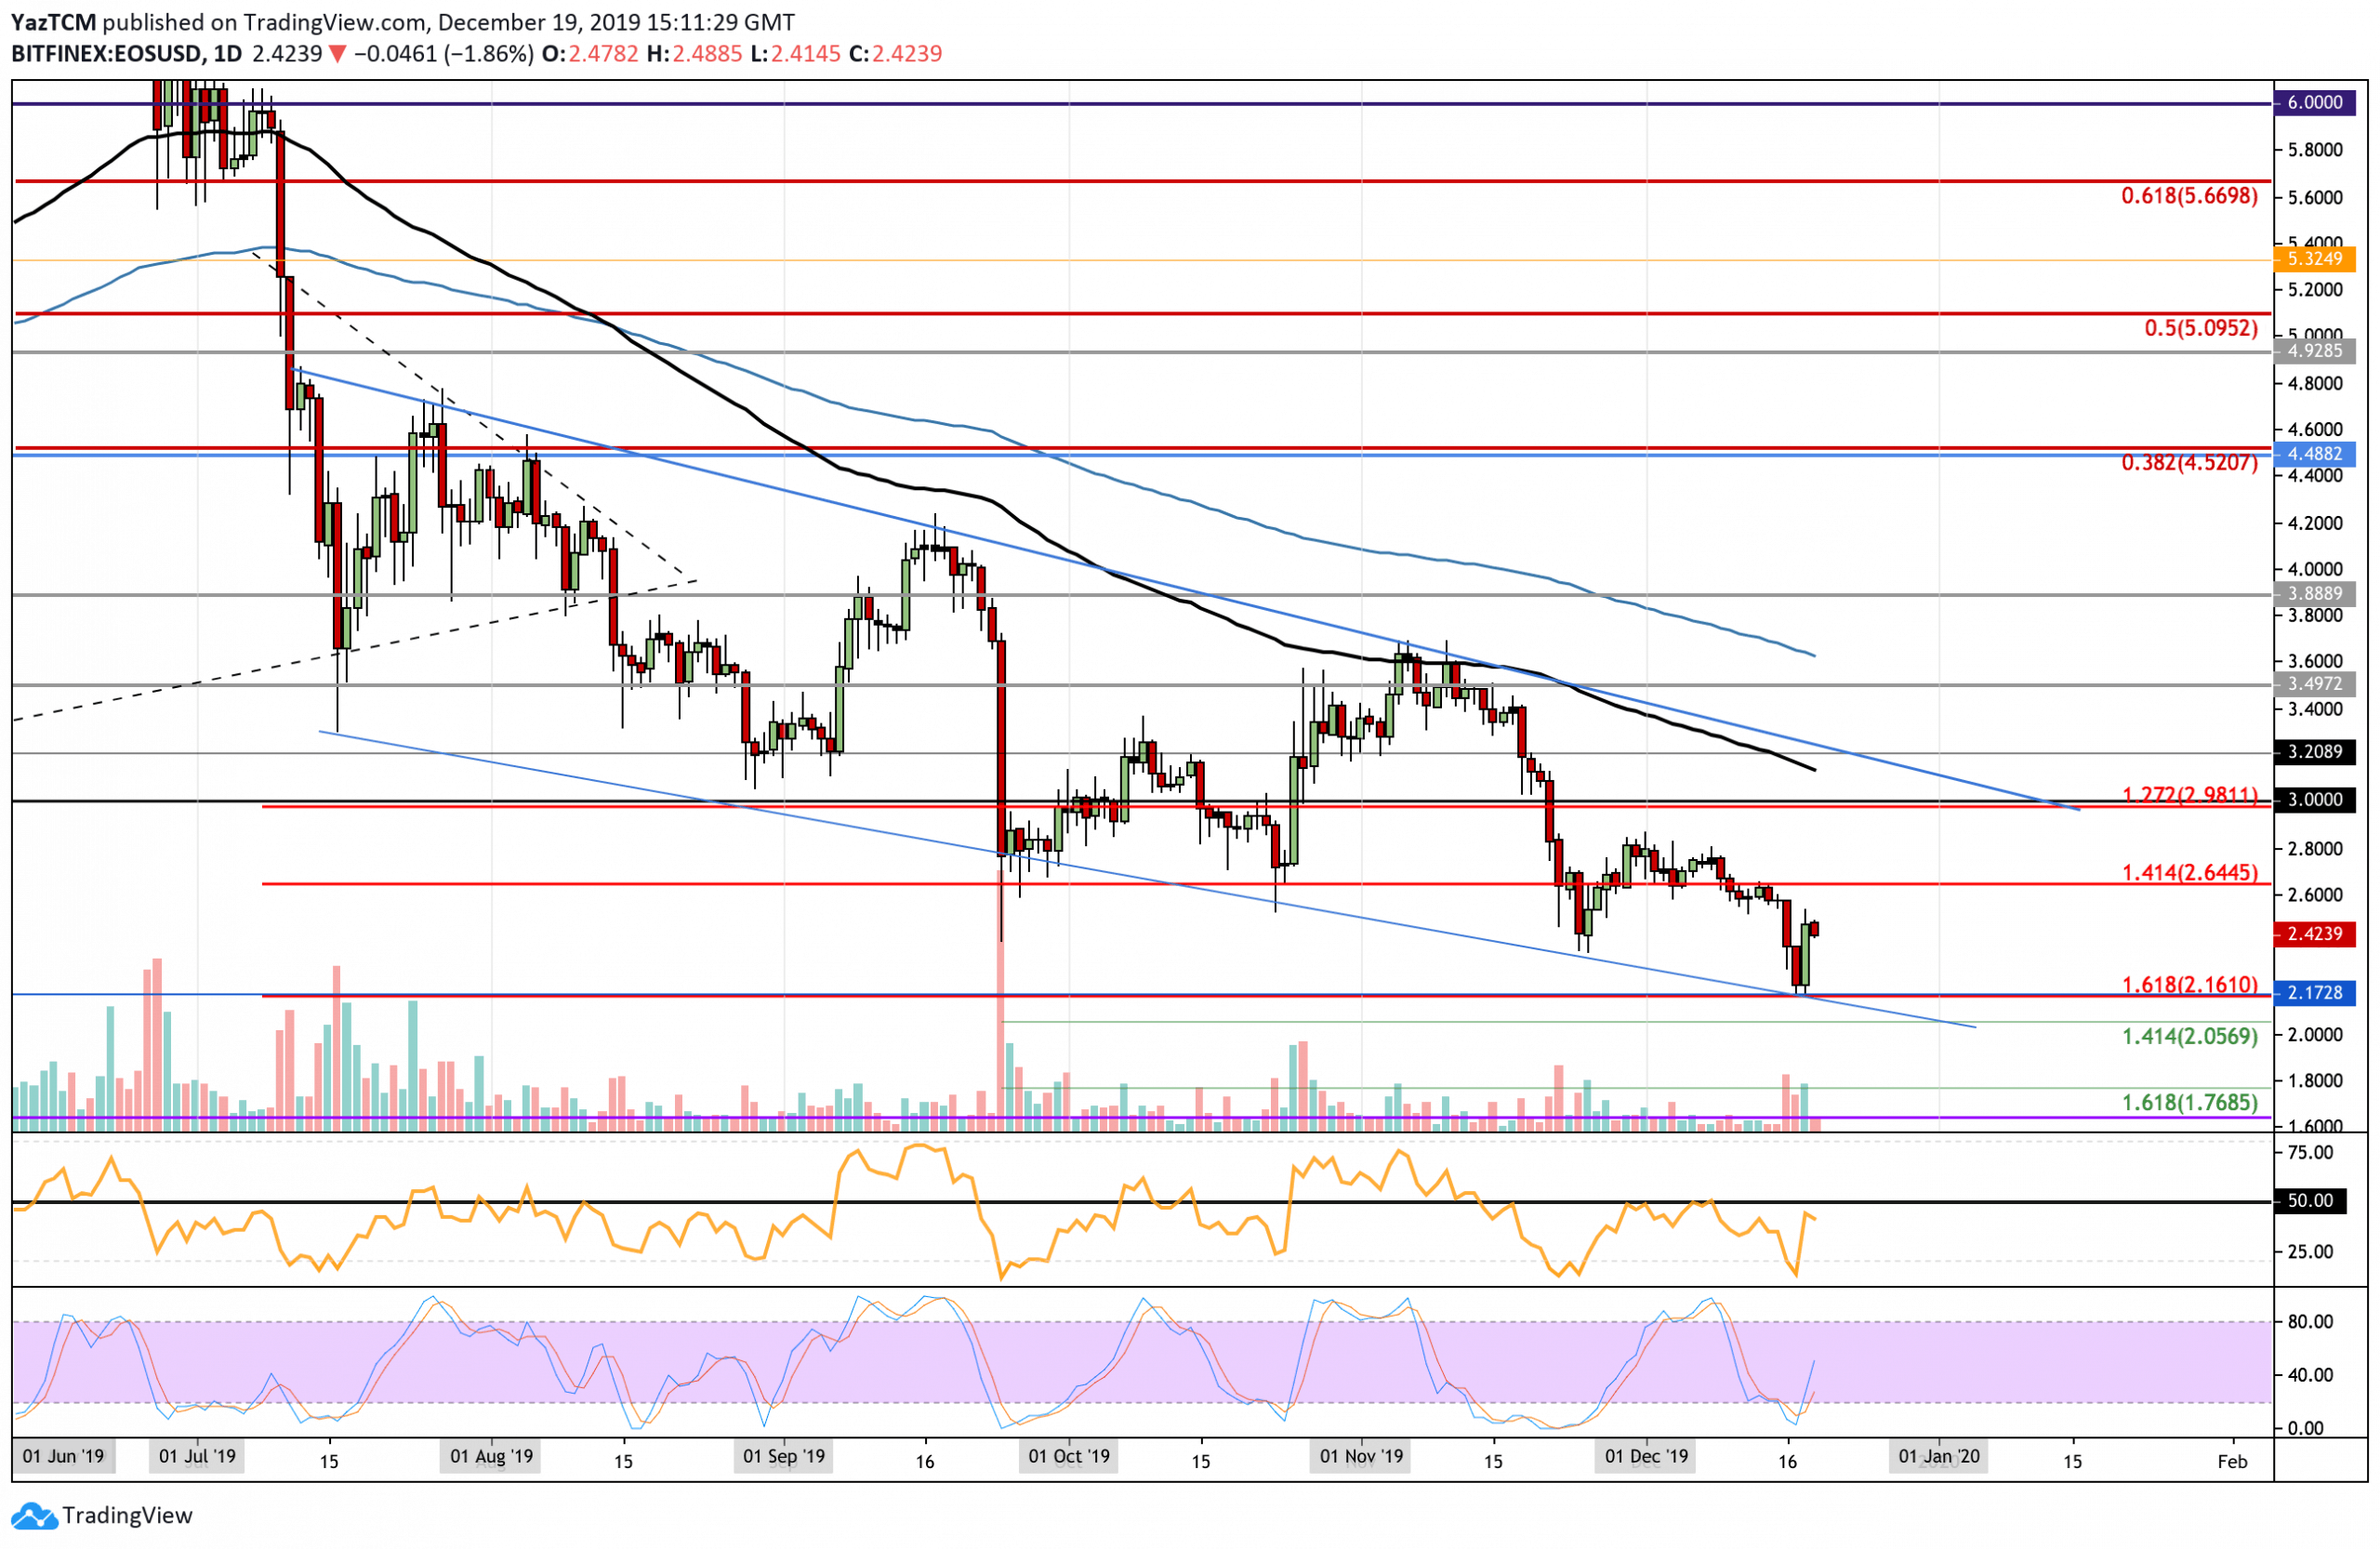
The daily chart above shows that EOS has been trading within a downtrend over the past six months. The cryptocurrency recently found support at $2.16, which is provided by a downside 1.618 Fibonacci Extension level. This also happens to be the 2019 low price.
If EOS were to collapse beneath $2.16, then the market would continue to be bearish. For it to be considered as bullish, EOS must rise and break above the upper boundary fo the descending channel at around $3.20.
EOS Short Term Price Prediction
If the bulls can rebound from this level of support and continue higher, an initial resistance is located at $2.62 and $2.80 (December highs). Above this, resistance lies at $3.00 and $3.15 (100-days EMA). Alternatively, toward the downside, initial support is expected at $2.16. If the sellers break beneath here, additional support is projected at $2.05, $180, and $1.76.
The RSI has started to rise from oversold conditions, which shows that the selling momentum is fading. However, the RSI must break above the 50 level to confirm that the bulls are taking control. Furthermore, the Stochastic RSI recently produced a bullish crossover signal that could help the market start to rise higher!
EOS/BTC: Trapped Within 6-Month Symmetrical Triangle
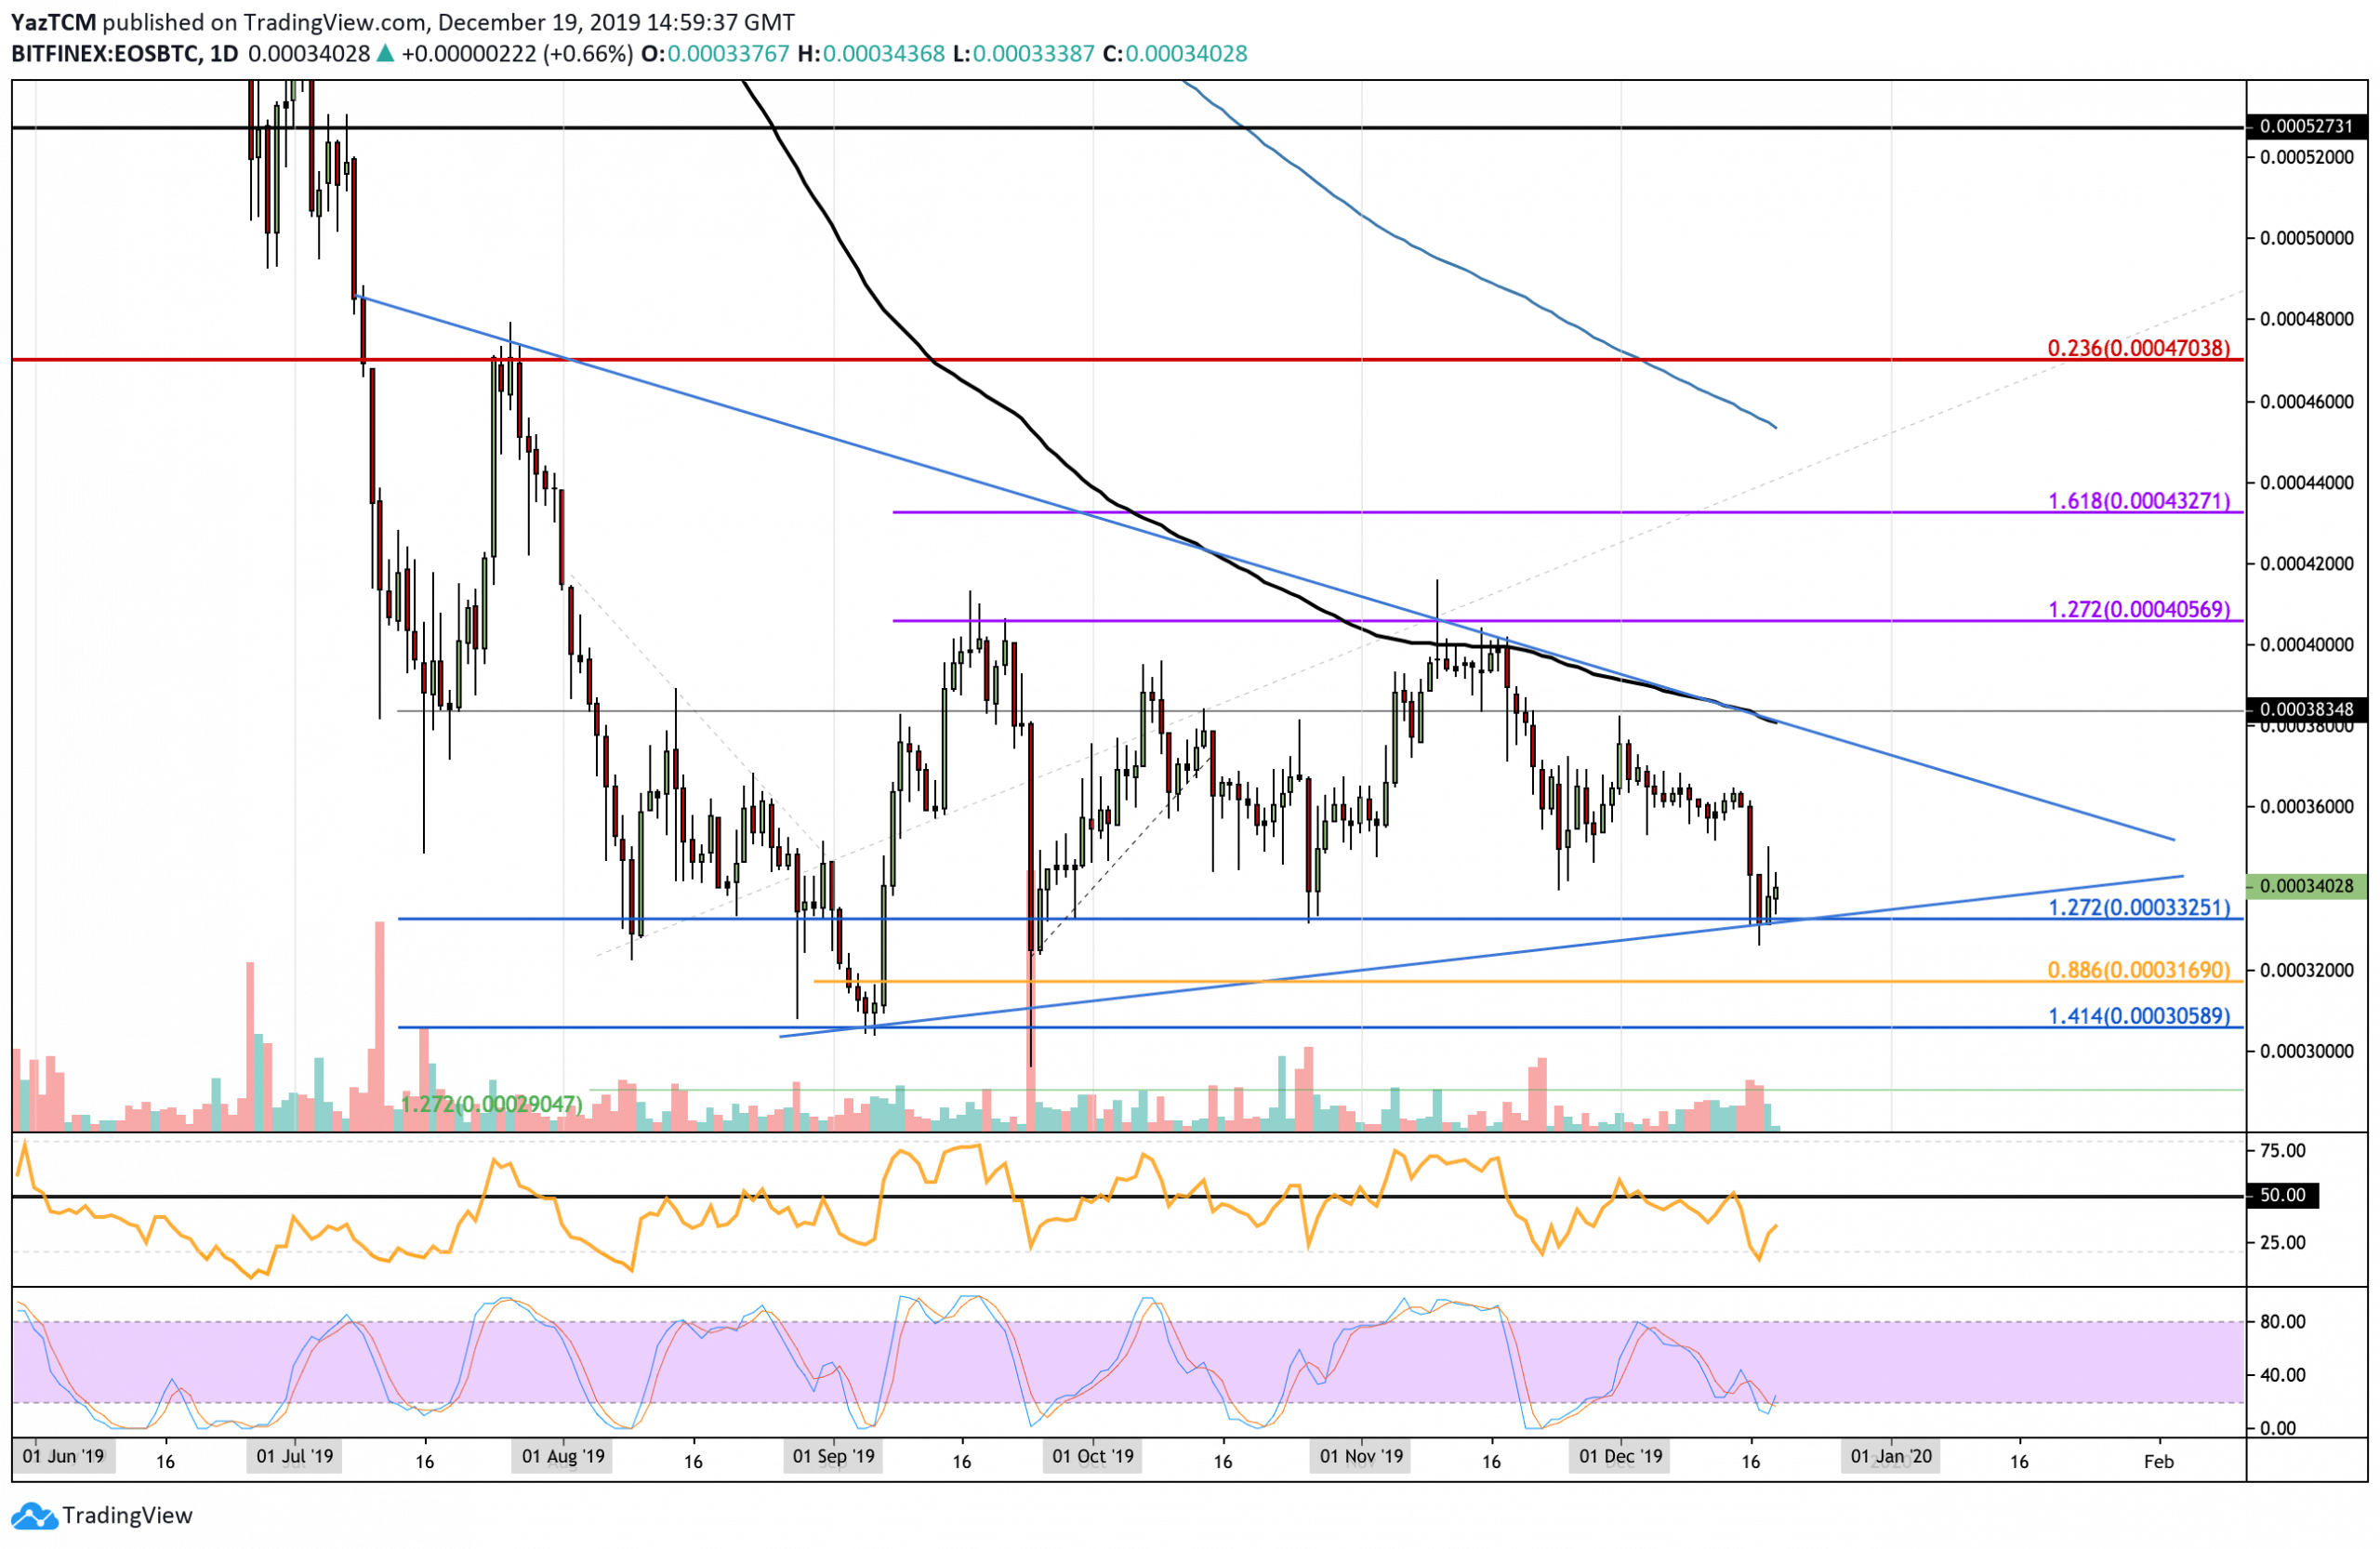
Against Bitcoin, EOS has been trapped within a symmetrical triangle for the last 6-months of trading. It recently found support at the lower boundary of the triangle and saw a brief rebound higher. The 1.272 Fib Extension level further bolstered this area of support.
This market is considered as neutral until a breakout of the triangle. To turn bullish, the coin must break above the upper boundary at 0.000383 BTC. If EOS were to drop beneath 0.000332 BTC, then the market would be considered as bearish.
EOS Short Term Price Prediction
If the sellers do end pushing EOS beneath the support at 0.000332 BTC and beneath the triangle, immediate support is located at 0.00316 BTC (.886 Fibonacci Retracement level). Beneath this, support lies at 0.000305 BTC (downside 1.414 Fib Extension) and 0.00030 BTC.
Alternatively, if the bulls regroup and start to push higher, immediate resistance is expected at 0.00036 BTC. Above this, resistance lies at 0.00038 BTC (upper boundary and 100-days EMA), and 0.0004 BTC.
The Stochastic RSI is primed for a bullish crossover signal that should see the market heading toward the upper boundary of the triangle.
Disclaimer: Information found on CryptoPotato is those of writers quoted. It does not represent the opinions of CryptoPotato on whether to buy, sell, or hold any investments. You are advised to conduct your own research before making any investment decisions. Use provided information at your own risk. See Disclaimer for more information.
Cryptocurrency charts by TradingView.
Technical analysis tools by Coinigy.
You might also like:
The post appeared first on CryptoPotato


