
After touching $115 on December 18, ETH grew by nearly 50% in the month that followed. While 2019 was not too favorable for Ethereum, 2020 might push it to greener pastures. Valued at $161 at the time of writing, ETH has a market capitalization of nearly $17.7 billion, with almost $14.6 billion worth of ETH traded over the last 24 hours.
Ethereum 1-day chart
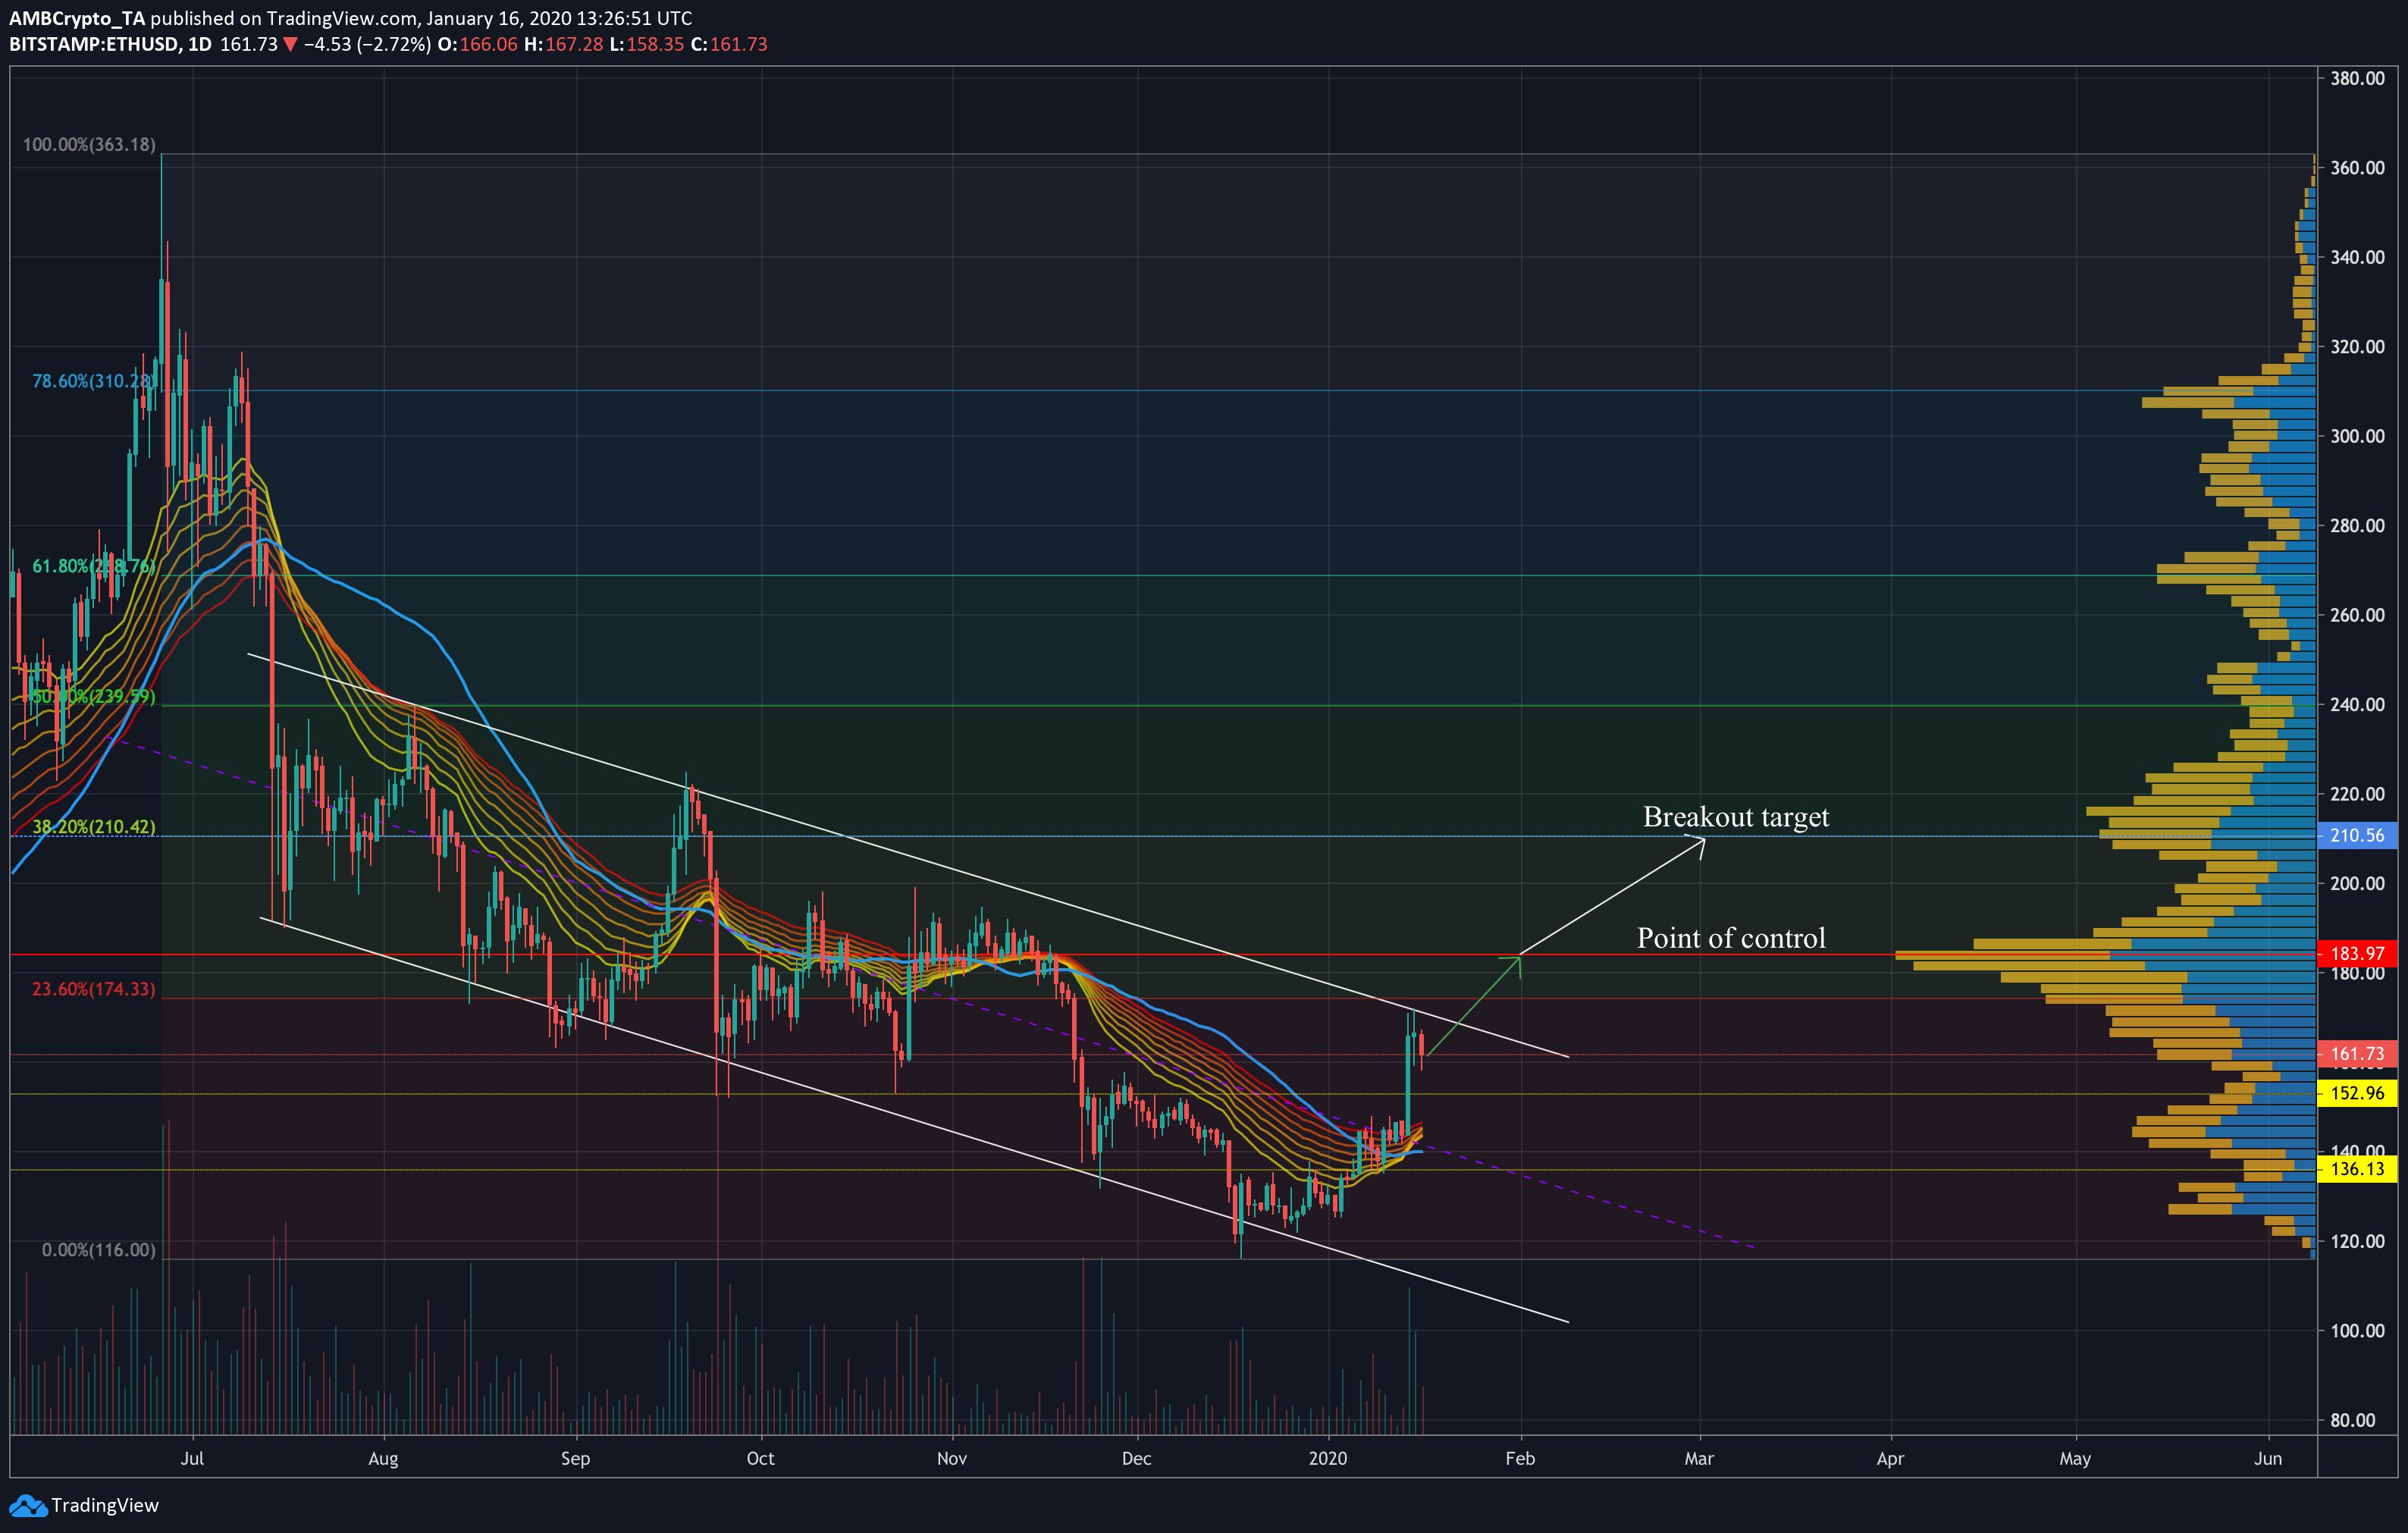
Source: ETHUSD on TradingView
The daily chart showed ETH has been in a descending channel formation since mid-July last year. These patterns are usually continuation patterns, though it seems unlikely that Ethereum will break downward from this pattern. The accompanying volume appeared to trend downward, spiking as the price approached the pattern boundaries. The 50-day moving average, a popular indicator of future performance, was seen moving under the price candles, which is generally a bullish sign for an asset.
EMA ribbon lines were also seen moving under the price line, and appeared to have finished moving into a mean reversion. This is usually followed by a divergence between the lines and could lead to large price movements in the weeks to come.
NVT Ratio
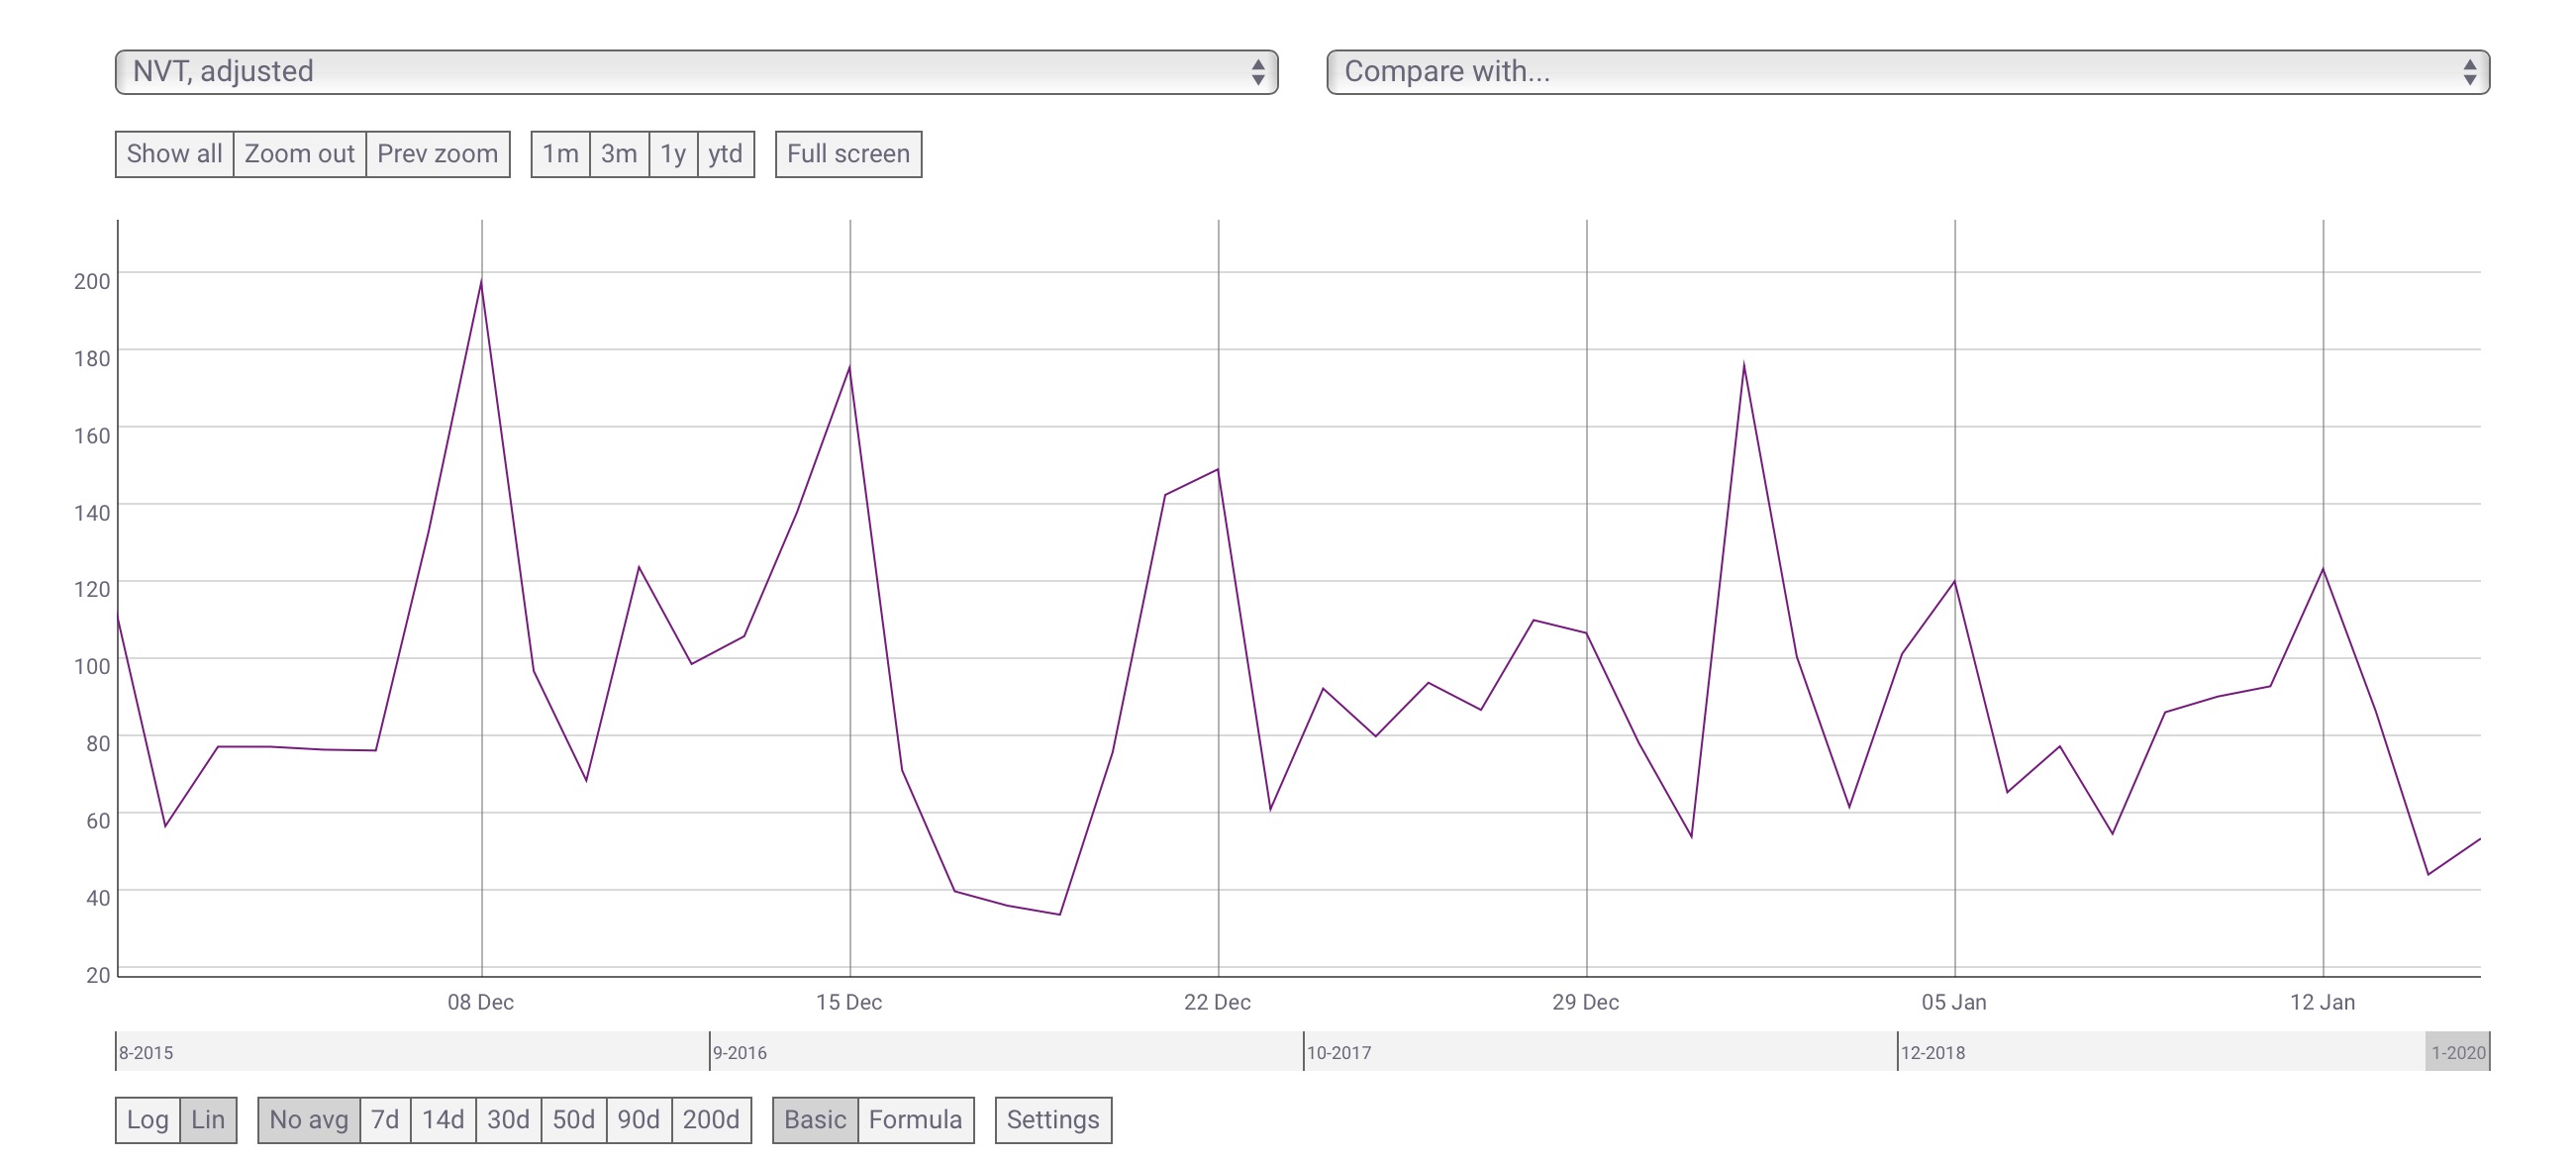
Source: CoinMetrics
CoinMetrics uses a metric called the Network Value to Transactions (NVT) ratio, which measures the dollar value of a crypto-asset’s transaction activity relative to its network value. A low NVT ratio usually indicates that an asset is more cheaply valued per unit of on-chain transaction volume.
Ethereum’s NVT ratio has been declining since the start of 2020, dropping from 176.2 on January 1 to 44.2 on January 14. It has risen since then, to around 55.6. This metric rising in recent times could be a sign that ETH is about to go up too, as it becomes more valuable per unit of on-chain volume.
Conclusion
With most indicators showing bullish signals, ETH is likely to break above the descending channel to the point of control on the volume profile, at nearly $184, in the weeks to come. Should ETH be able to push past the resistance at the point of control, the coin could rise up to $200 by March. If ETH dips down, it will likely find support at the $153 and $136 lines, though this seems unlikely given the position of the 50-DMA, EMA ribbon lines and the movements of the NVT ratio metric in recent times.
The post appeared first on AMBCrypto


