
- Ethereum finally broke above the $150 level but now struggles at the resistance at $152.
- ETH broke beneath the lower boundary of the symmetrical triangle as expected.
- The bulls are attempting to gain control over the momentum but have failed to break above the 50 level on the RSI so far.
Key Support & Resistance Levels
Support: $145, $138.80, $133.50
Resistance: $152, $158.60, $165, $170.
Support: 0.0196 BTC, 0.019 BTC, 0.0185 BTC
Resistance: 0.020 BTC, 0.021 BTC, 0.0215 BTC, 0.0223 BTC
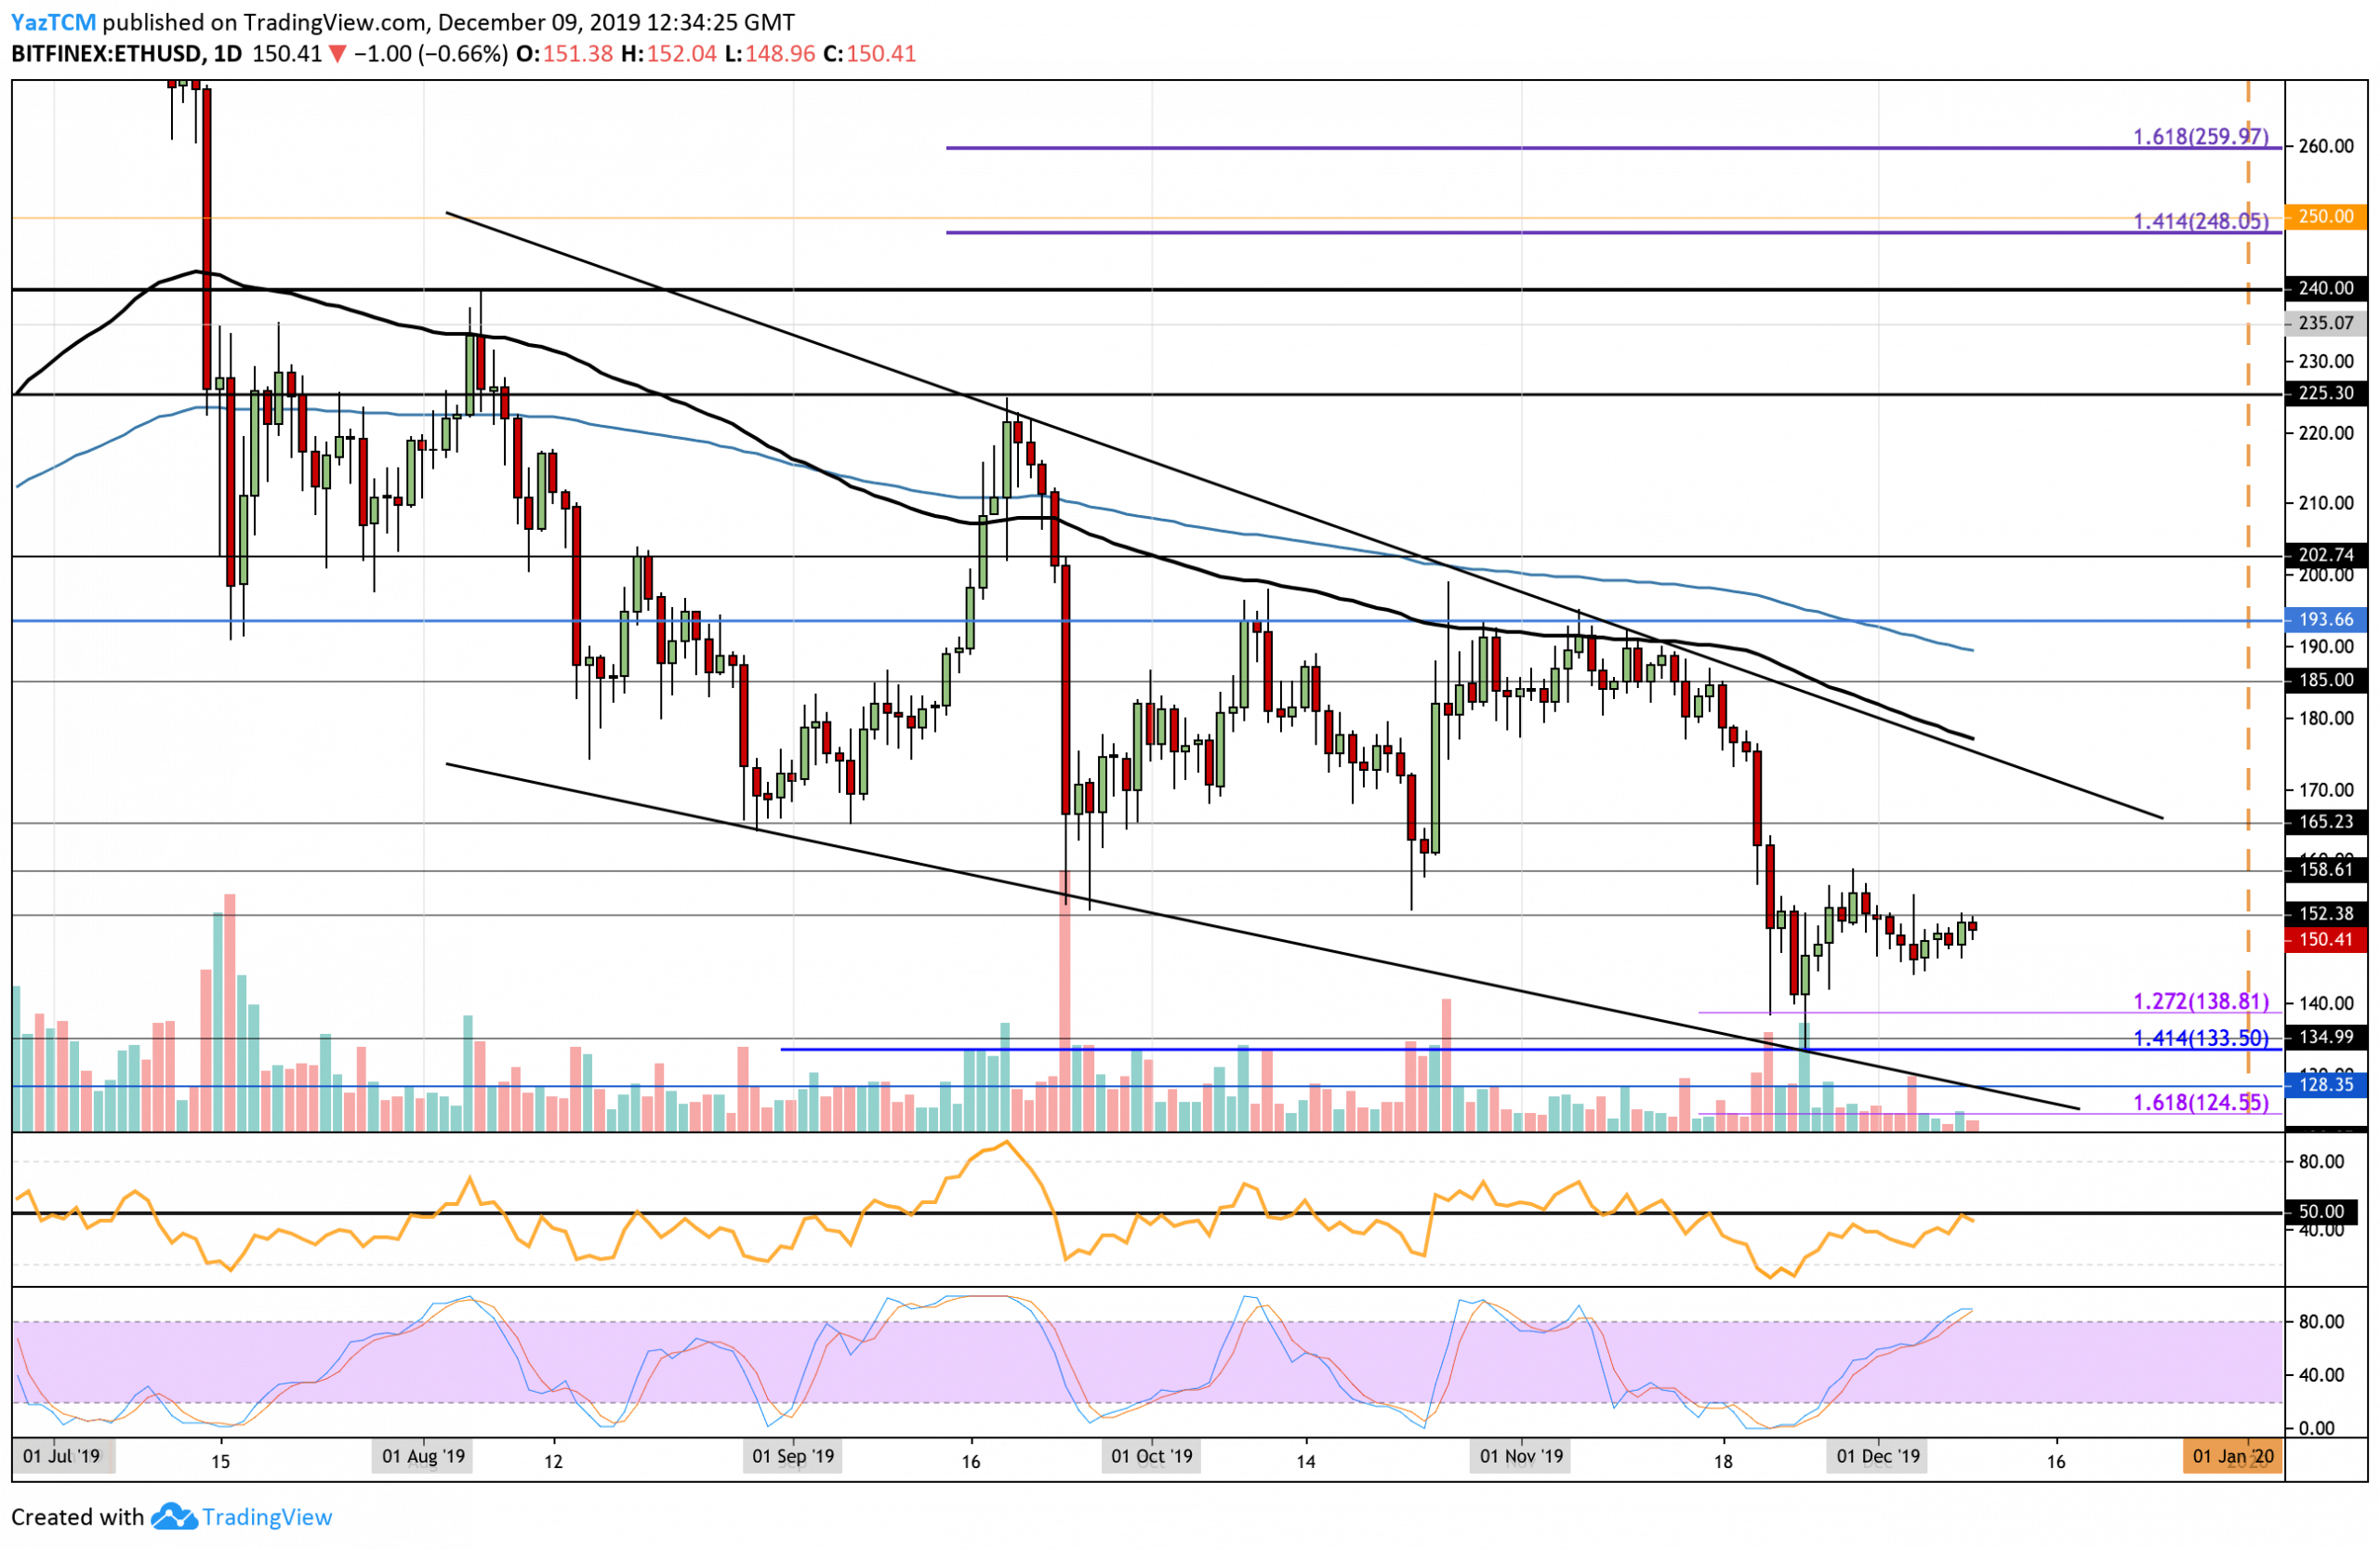
Since our last analysis, Ethereum continued to rise higher above the $150 level but has struggled to make any ground above the resistance at $152.40. The bulls attempted to break above the 50 level on the RSI but started to point downward as it reached 50. Furthermore, the Stochastic RSI has also reached overbought conditions and is primed for a bearish crossover signal that will send the market lower.
Ethereum Short Term Price Prediction
The sentiment for ETH could be classified as bearish. For it to continue it has to drop beneath the $133.50 support. To turn bullish in the short term, a break above $158 could see ETH reaching the $170 level.
For Ethereum to continue higher, ETH needs to break above the resistance at $152. For this to happen, we must see the volume begin to increase as it has been very low during the entire period of December 2019. Above $152, resistance is located at $158, $165, and at $170 (upper boundary of long term descending price channel). Alternatively, if the sellers step back in, we can expect immediate support at $145. Beneath this, support lies at $138.80, $133.50 (November lows), and $130 (lower boundary of price channel).
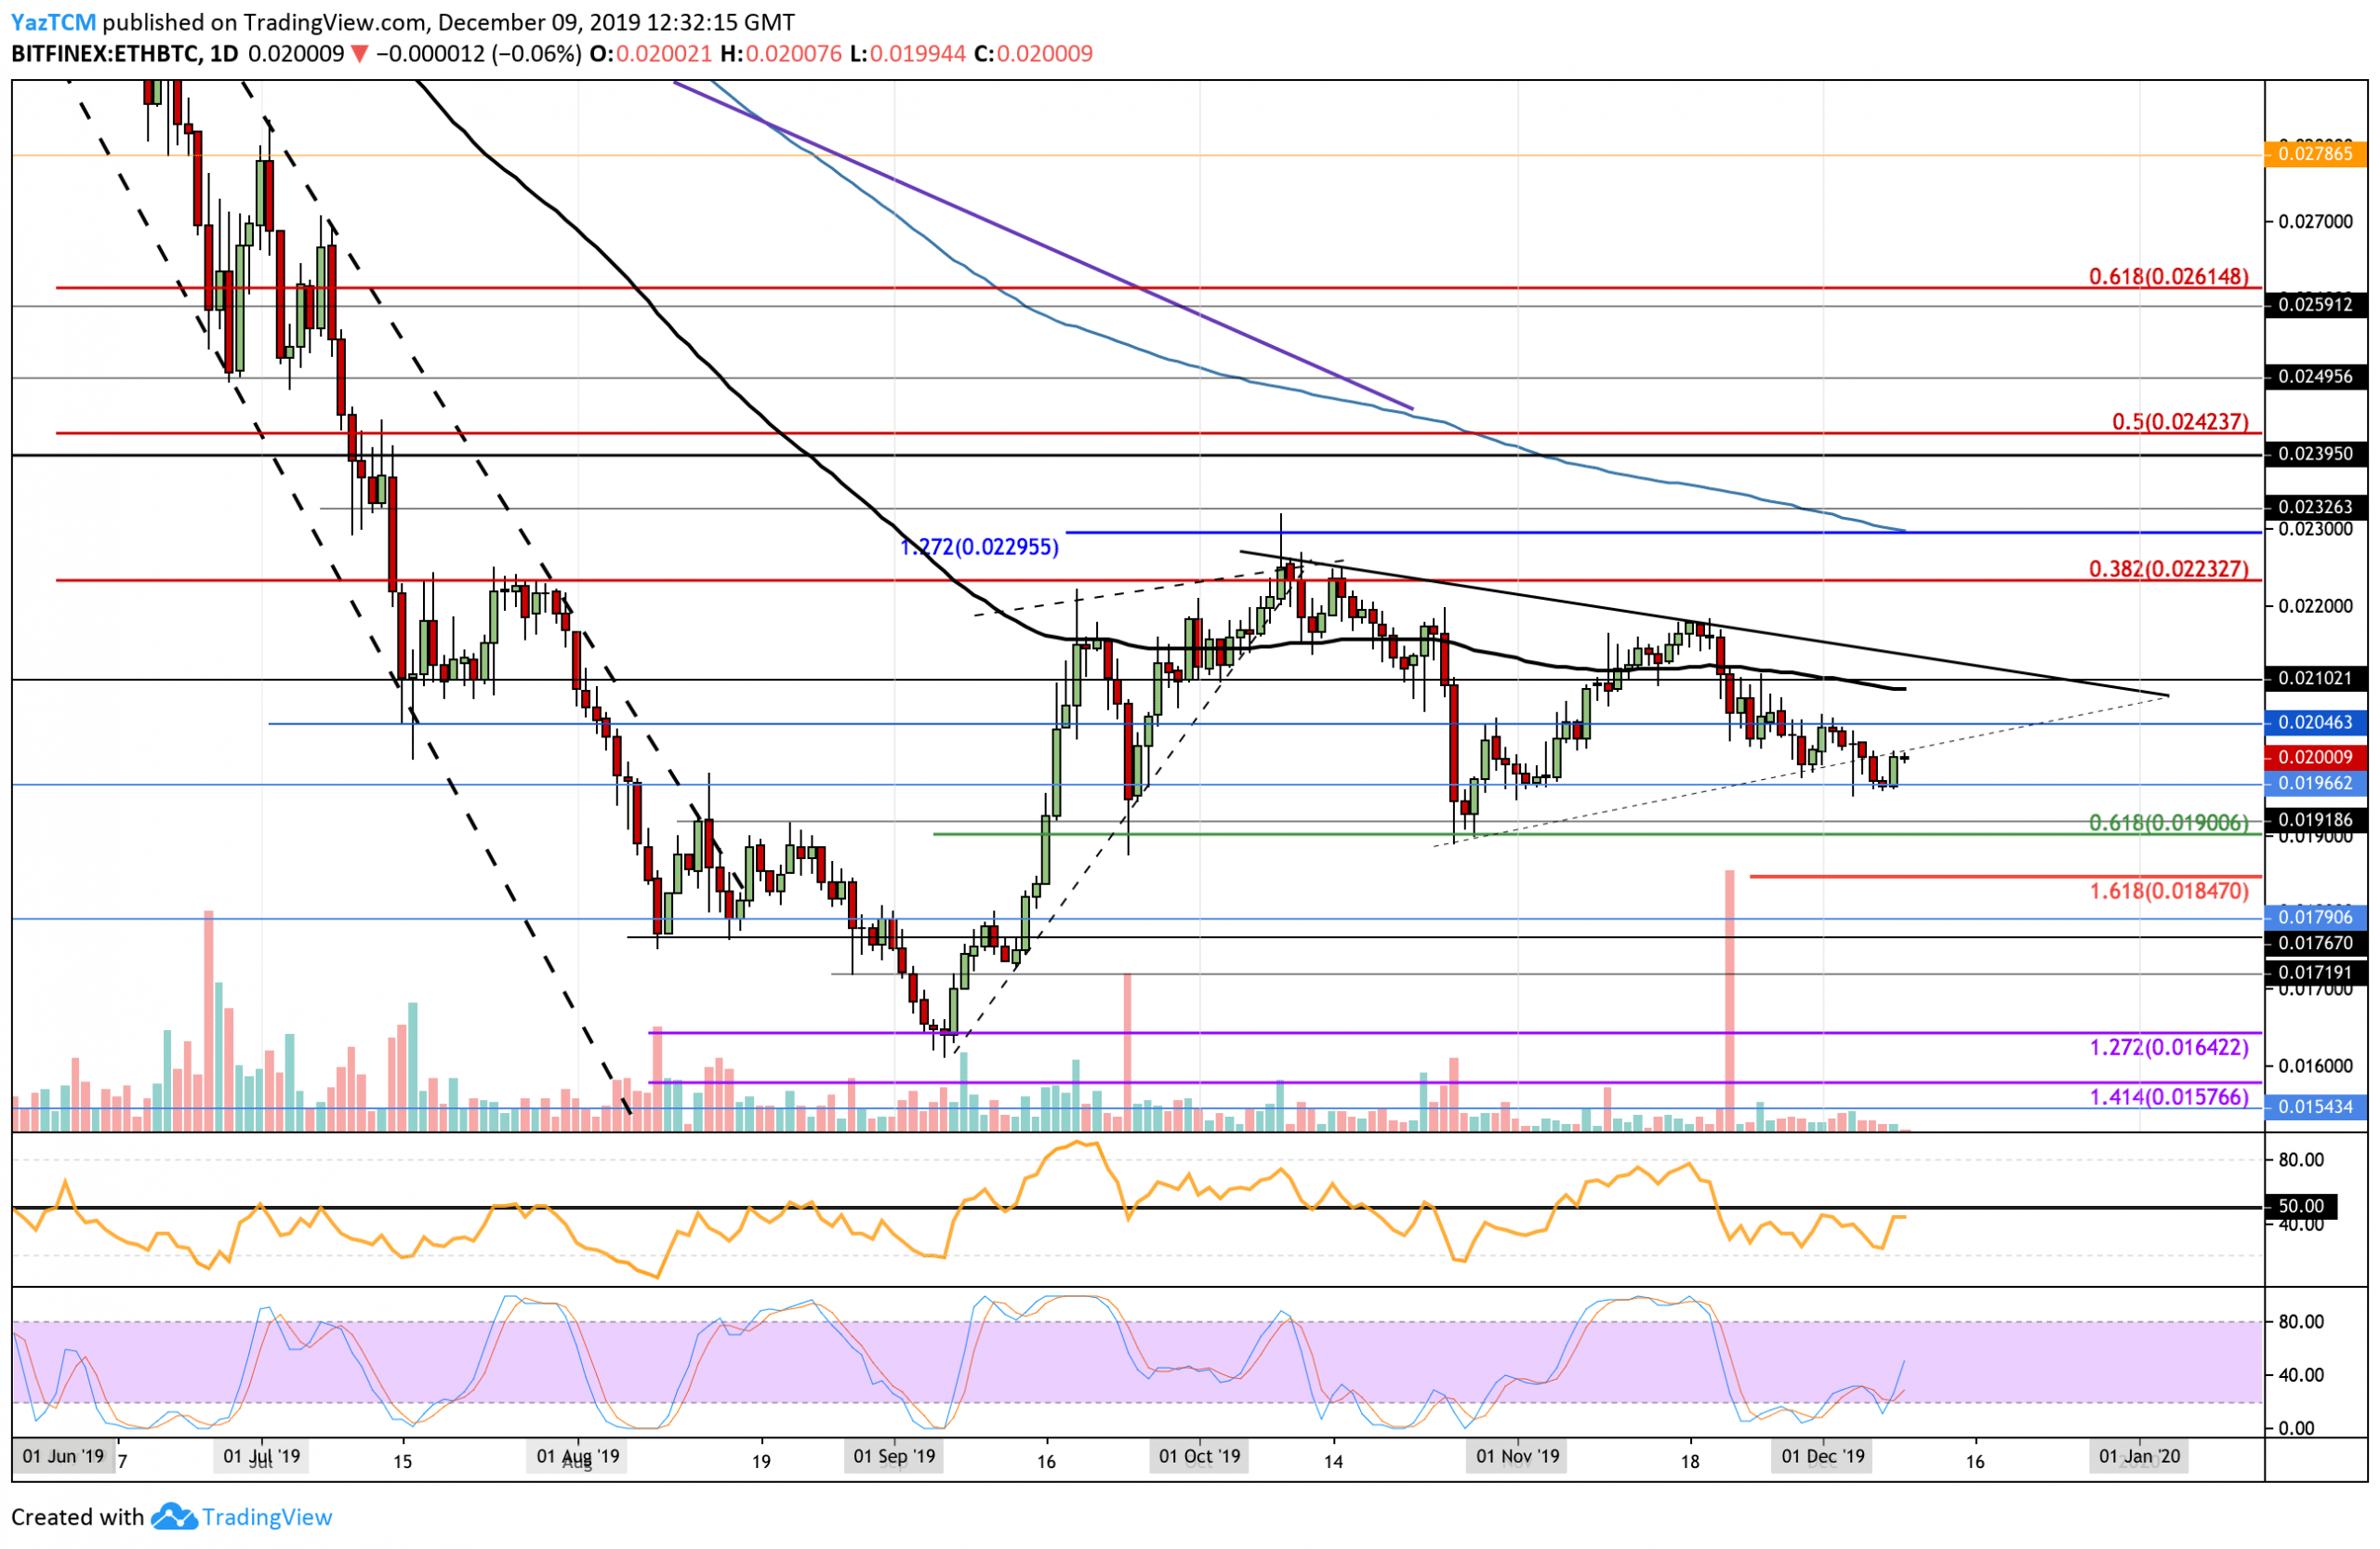
Against Bitcoin, Ethereum broke beneath the 2-month old symmetrical triangle that we have been tracking. After that, it managed to find support at the 0.01966 BTC level where the cryptocurrency bounced slightly higher into the 0.02 BTC level.
The RSI remains in the favor of the bears, however, the Stochastic RSI has recently produced a strong bullish crossover signal which could be the initial sign of an incoming bullish press higher.
Ethereum Short Term Price Prediction
Ethereum still remains in a neutral market against Bitcoin. For it to turn bearish, we would need to see it dropping beneath 0.019 BTC. To turn bullish, ETH must break above the November highs.
If the bulls can continue higher from the 0.02 BTC level we can expect immediate resistance to be located at 0.0204 BTC and 0.021 BTC (100-days EMA). Higher resistance then lies at 0.0218 BTC (November highs). On the other hand, if the sellers regroup and pressure the market lower, we can expect immediate support at 0.01966 BTC. Added support is then found at 0.019 BTC (.618 Fib retracement) and 0.01847 BTC.
Disclaimer: Information found on CryptoPotato is those of writers quoted. It does not represent the opinions of CryptoPotato on whether to buy, sell, or hold any investments. You are advised to conduct your own research before making any investment decisions. Use provided information at your own risk. See Disclaimer for more information.
Cryptocurrency charts by TradingView.
Technical analysis tools by Coinigy.
You might also like:
The post appeared first on CryptoPotato


