
- Ethereum witnessed a small 3% price drop today, causing the price for the coin to fall beneath $165.
- Against BTC, ETH failed to make any ground above the 100-days EMA and has since fallen back beneath.
- Despite the recent price drop, bulls may be hanging in there until the price falls to $158.
Key Support & Resistance Levels
Support: $158, $152, $145, $133.50.
Resistance: $172, $175, $180, $186, $194.
Support: 0.019 BTC, 0.0188 BTC, 0.0185 BTC, 0.0171 BTC.
Resistance: 0.0195 BTC, 0.02 BTC, 0.0204 BTC.
ETH/USD: ETH Fails To Break Above 200-Days EMA, Will It Hold Above the 100-Days EMA?
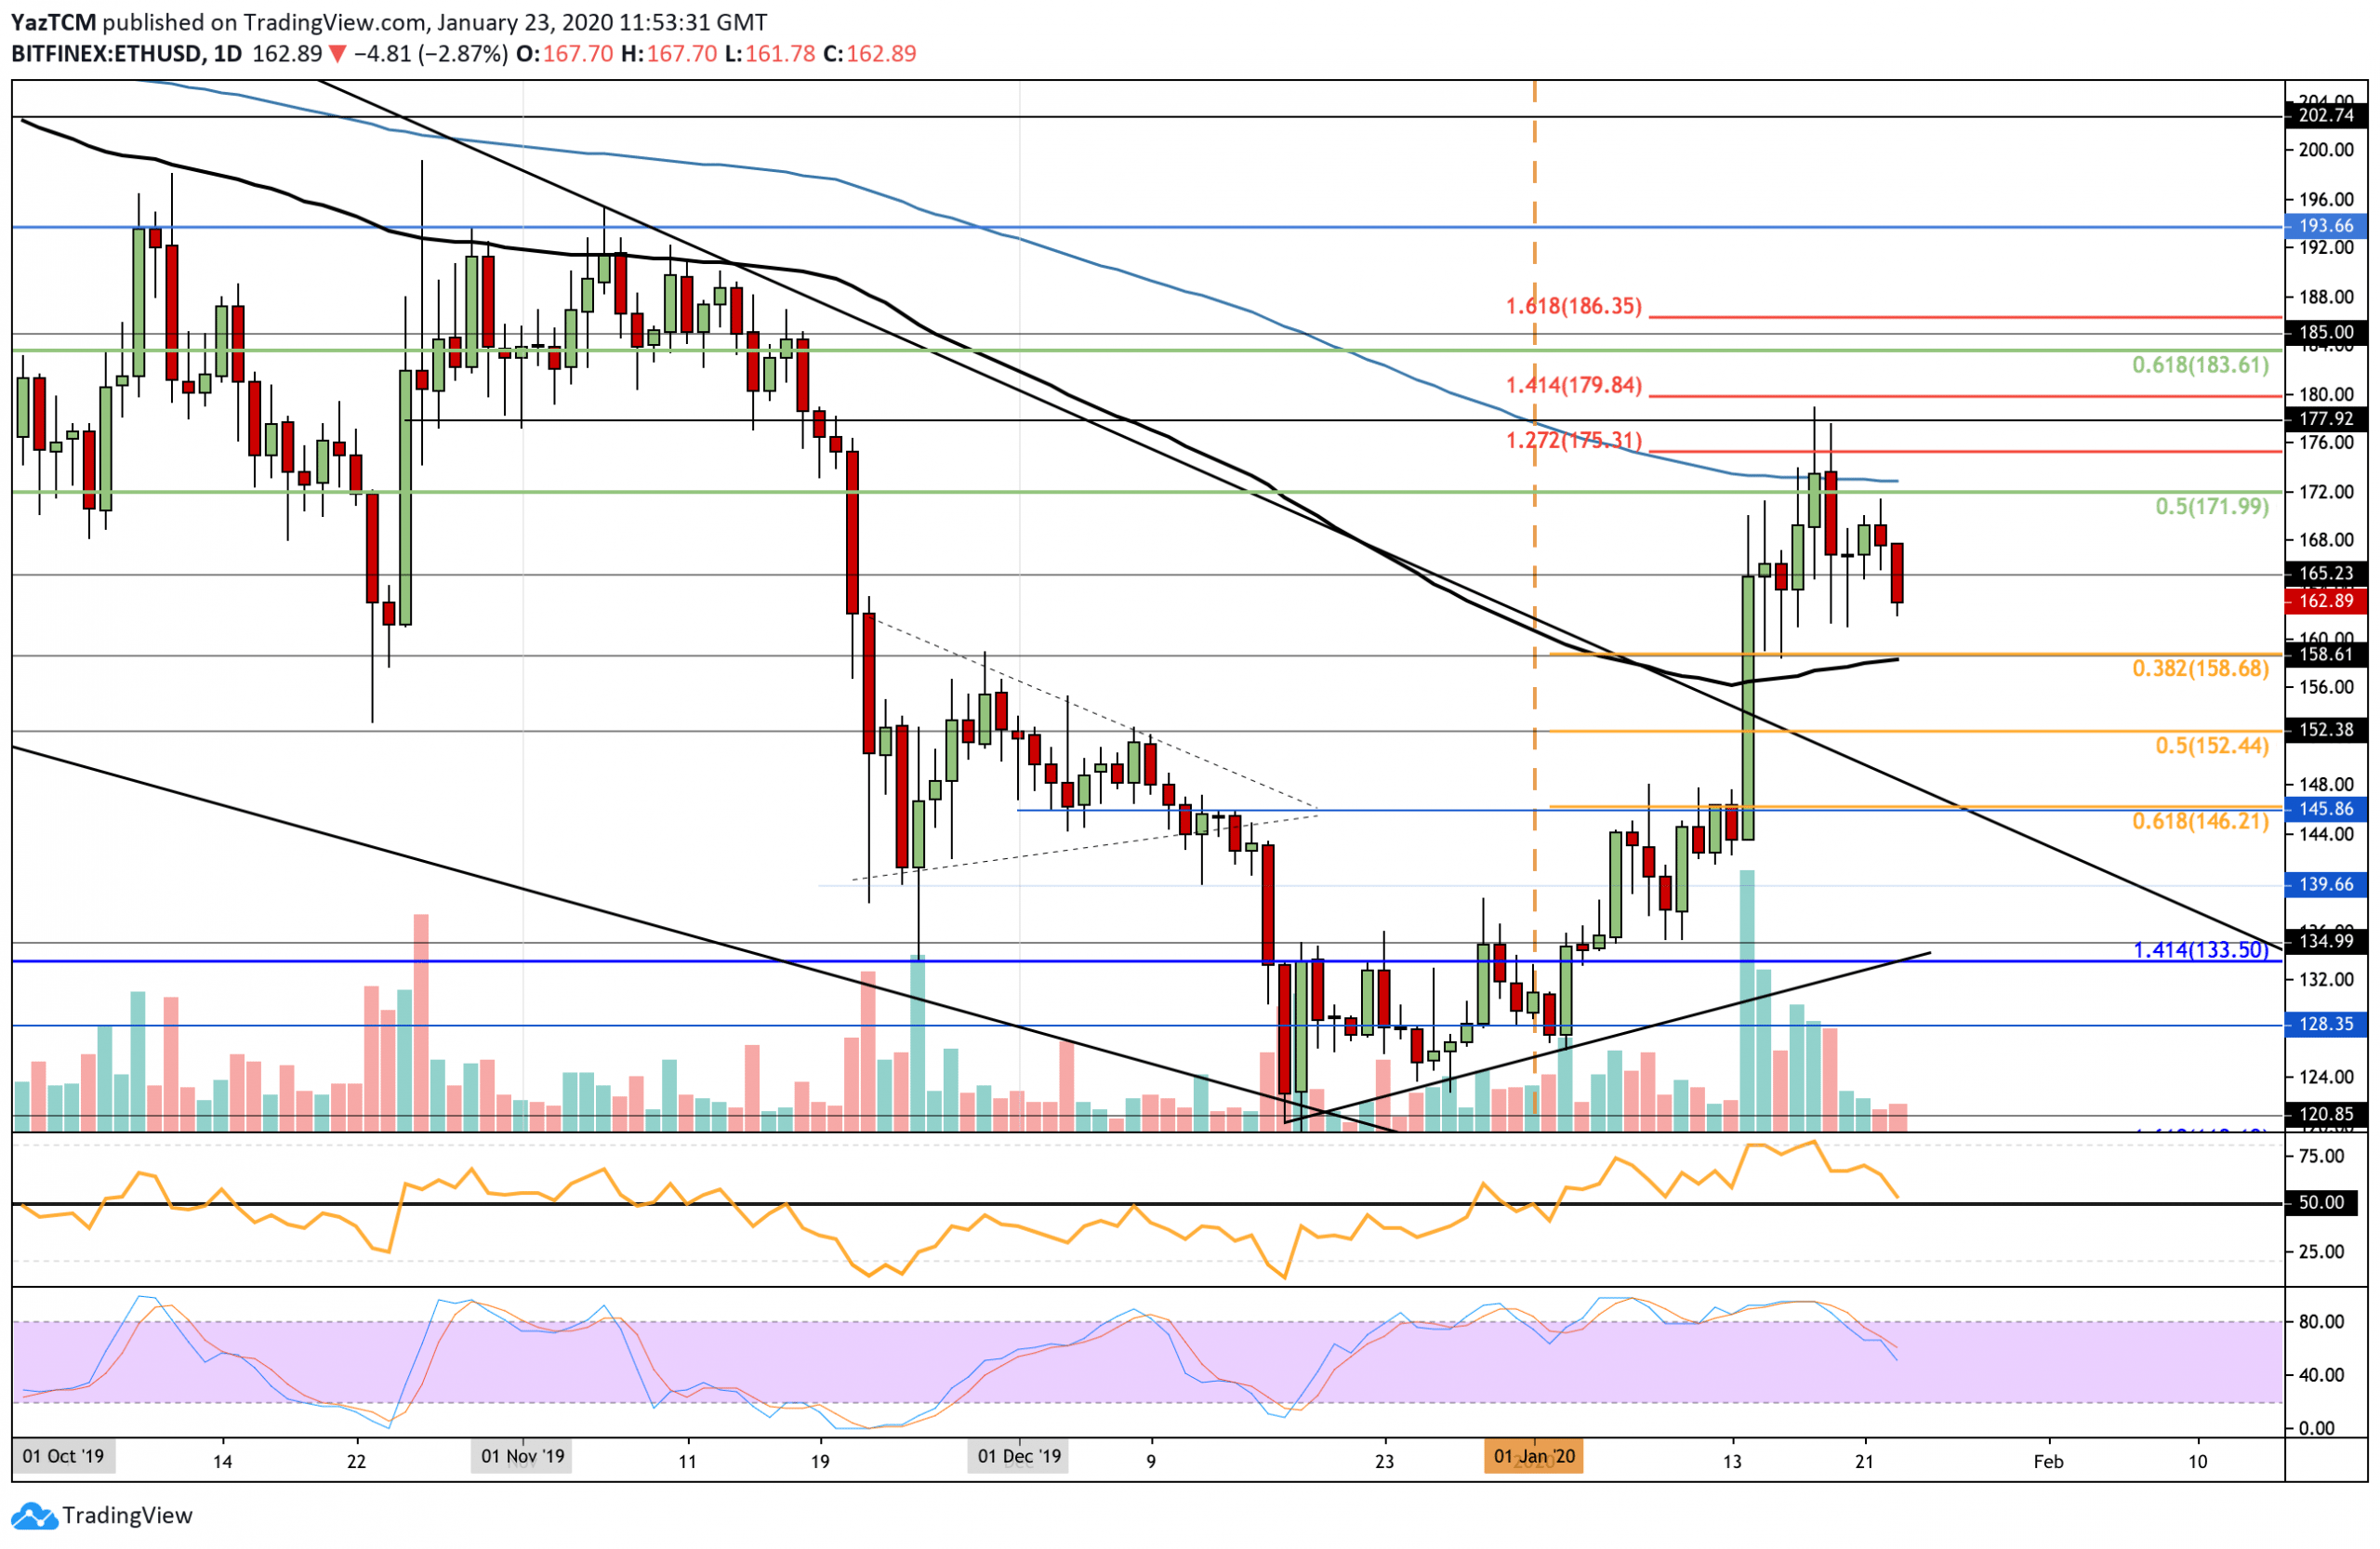
Since our last analysis, ETH struggled at the resistance provided by the 200-days EMA at around $173. It did manage to spike as high as $179. However, the coin was unable to close above the 200-days EMA, causing it to roll over and fall. ETH is now trending lower as it breaks beneath $162.
ETH remains bullish unless it drops beneath the support at $158, which is provided by the 100-days EMA. For it to turn bearish, the market would need to collapse beneath the support at $133.50.
Ethereum Short Term Price Prediction
If the sellers continue to drive ETH lower, the first level of support is expected at $158.70, which is provided by the short term .382 Fibonacci Retracement level and bolstered by the 100-days EMA. Beneath this, support lies at $152.44 (.5 Fibonacci Retracement), $150, and $146.21 (.618 Fibonacci Retracement). On the other hand, if the bulls defend the support at $160 and rebound higher, the first level of resistance is located at $165 and $172 (200-days EMA). Above this, resistance lies at $180 (1.414 Fibonacci Extension level) and $183.60 (bearish .618 Fibonacci Retracement)
The RSI has dropped from extremely overbought conditions and has returned to the 50 level, which shows indecision within the market. If the sellers continue to drive the RSI beneath the 50 level, this would indicate that the sellers have taken control over the market momentum. Furthermore, the Stochastic RSI recently produced a bearish crossover signal, and the moving averages in the indicator continue to expand away from each other.
ETH/BTC: ETH Meets 0.02 BTC But Retraces Beneath The 100-days EMA
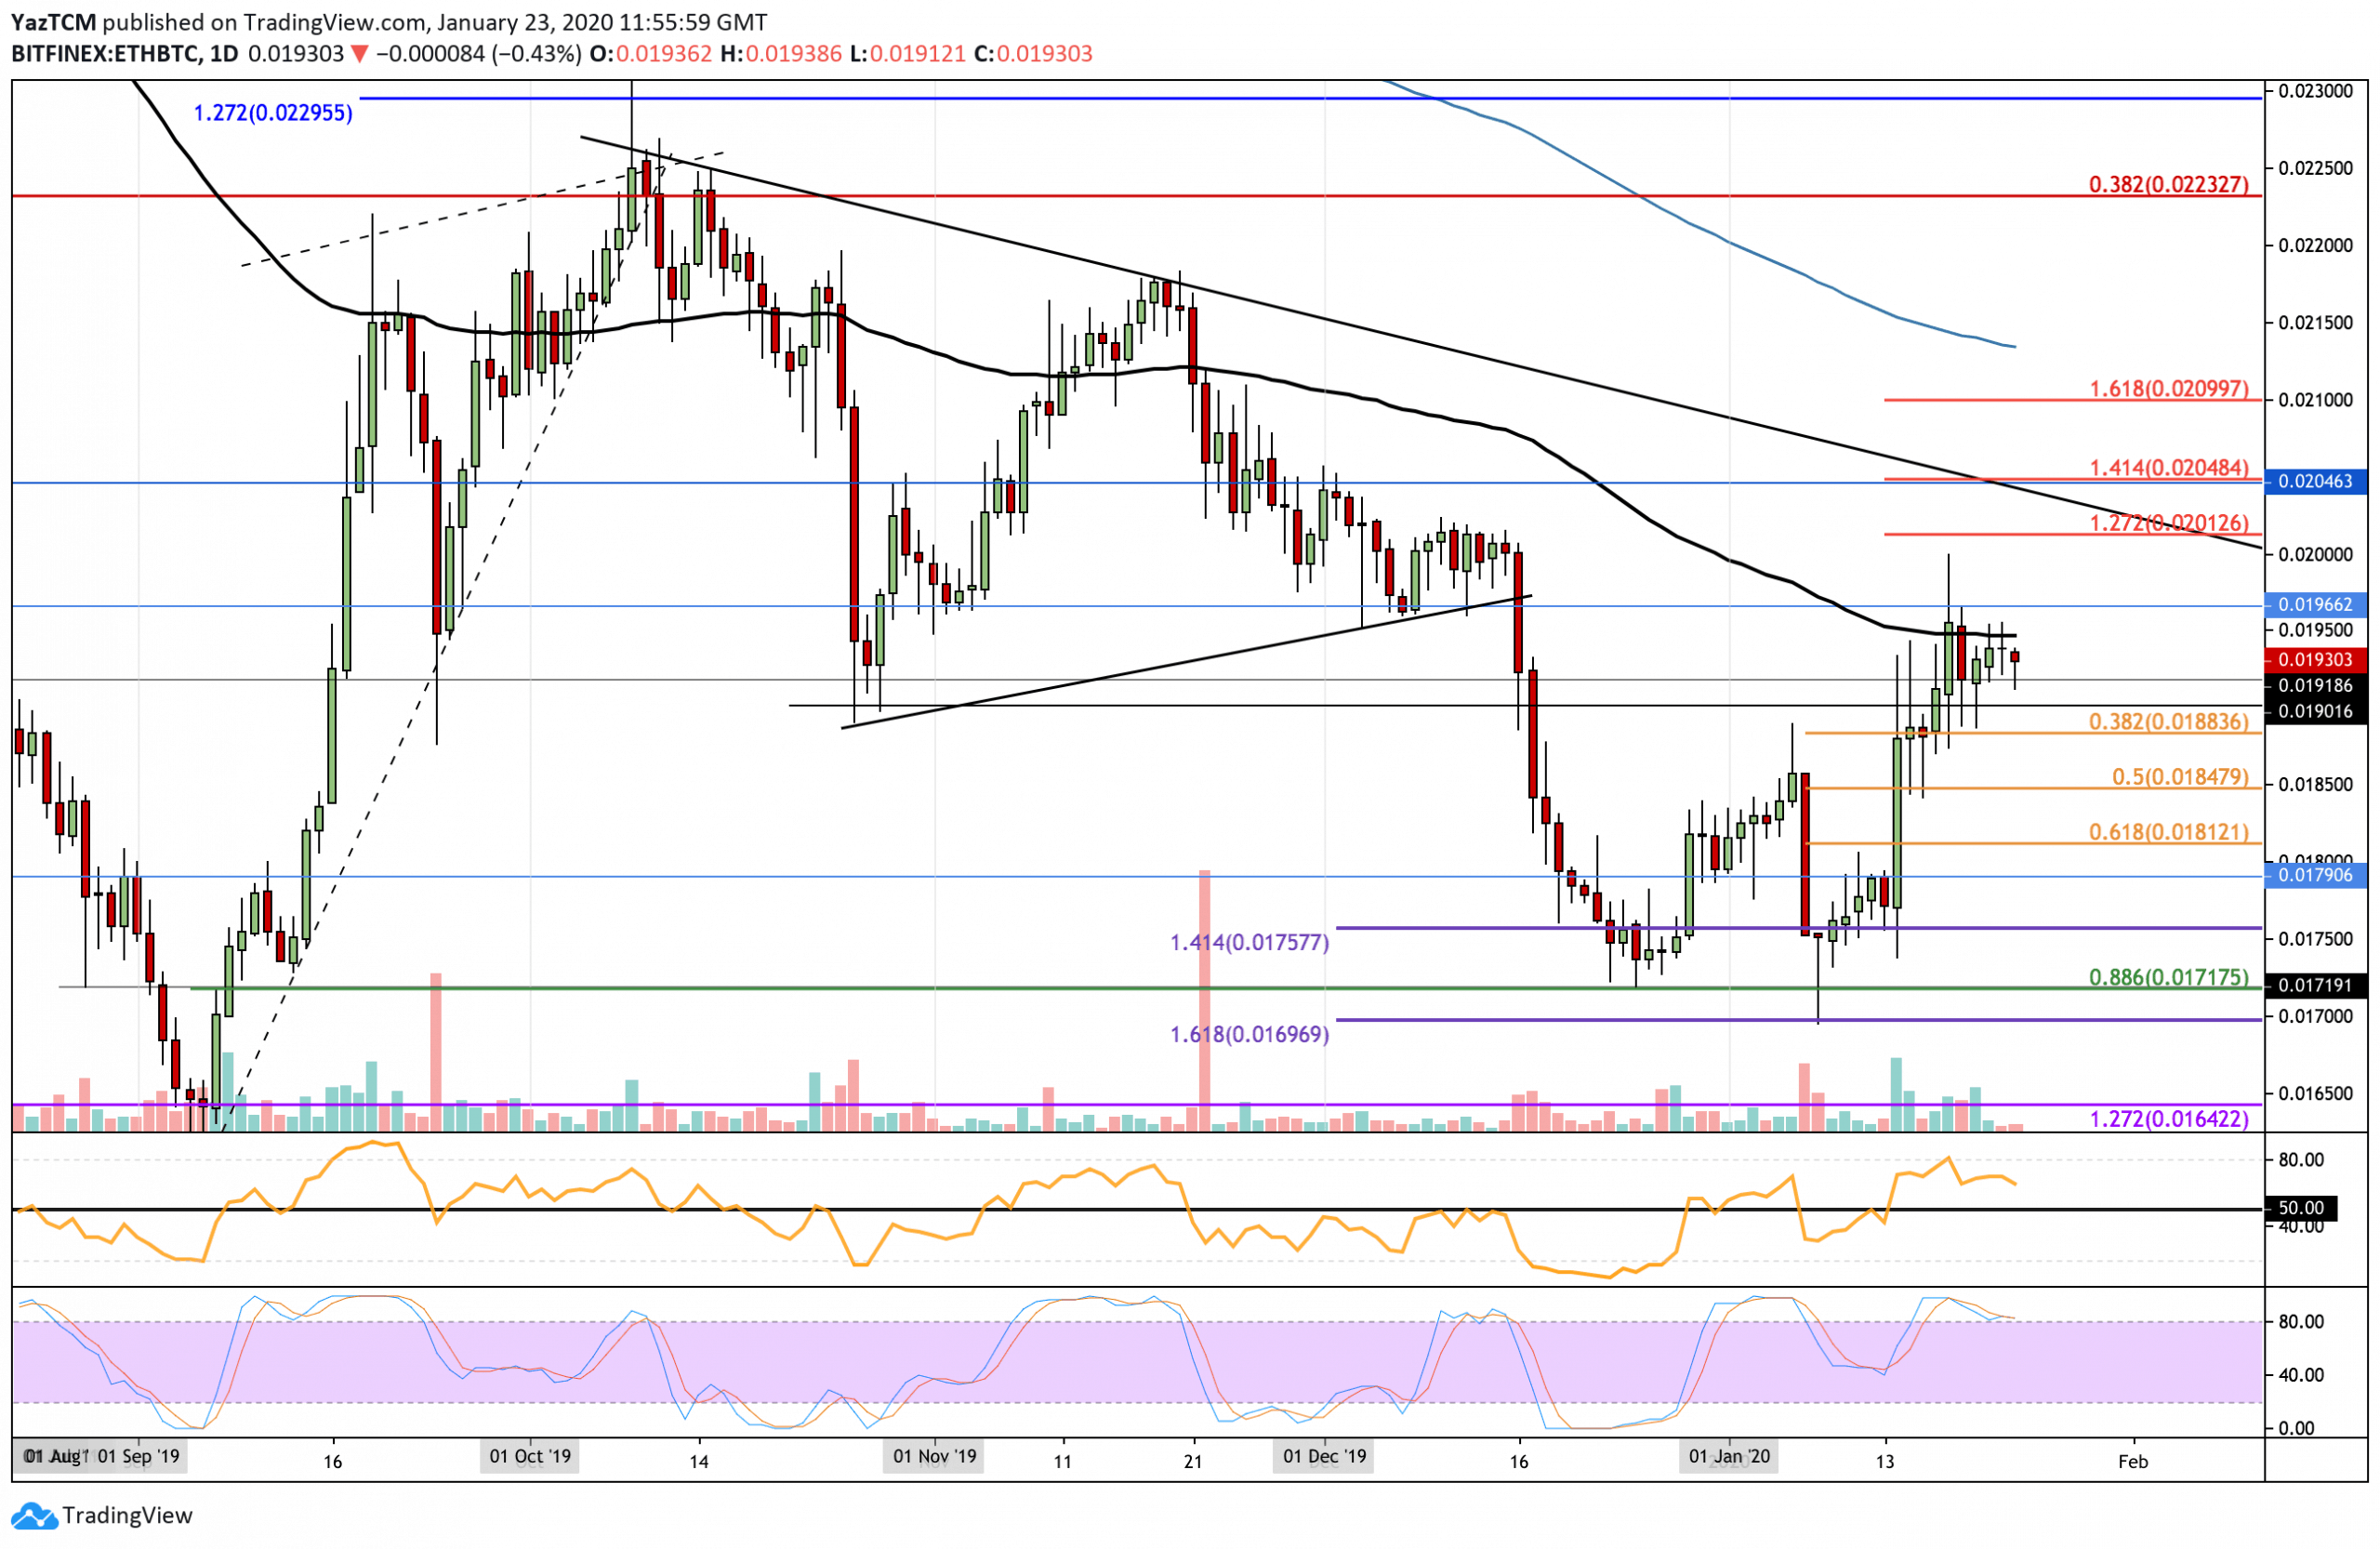
Against Bitcoin, ETH found strong resistance at the 100-days EMA and was unable to overcome it. It did manage to spike as high as 0.02 BTC, but this price surge was very brief as ETH tumbled back beneath the 100-days EMA before the day closed. ETH has started to show some signs of weakness against BTC as it struggles at the 100-days EMA throughout the entire week.
ETH would still need to rise above the December 2019 high at 0.0204 BTC before being able to turn bullish. Nevertheless, it continues to trade in a neutral condition until this resistance is broken. If ETH drops beneath the support at 0.0185 BTC, then the market would be considered as bearish.
Ethereum Short Term Price Prediction
If the sellers continue to push ETH beneath 0.019 BTC, immediate support is located at 0.01883 BTC (.382 Fibonacci Retracement level). Beneath this, additional support lies at 0.0185 BTC (.5 Fibonacci Retracement), 0.0181 BTC (.618 Fibonacci Retracement level), and 0.0179 BTC. Alternatively, if the bulls can rebound from the current 0.0191 BTC support, the first level of resistance lies at 0.0195 BTC, where lies the 100-days EMA. Above this, resistance lies at 0.02 BTC, 0.0204 BTC (1.414 Fib Extension), and 0.021 BTC (1.618 Fibonacci Retracement).
The RSI is falling slightly, which shows that the bullish pressure is starting to fade. Furthermore, the Stochastic RSI is primed for a bearish crossover signal, which could send the market further lower.
Disclaimer: Information found on CryptoPotato is those of writers quoted. It does not represent the opinions of CryptoPotato on whether to buy, sell, or hold any investments. You are advised to conduct your own research before making any investment decisions. Use provided information at your own risk. See Disclaimer for more information.
Cryptocurrency charts by TradingView.
Technical analysis tools by Coinigy.
The post appeared first on CryptoPotato


