
- Ethereum increased by 7.8% today, bringing the price for the cryptocurrency to $212.
- It managed to break above an ascending price channel against Bitcoin to reach 0.0218 BTC.
- The latest surge has increased the market cap to almost reach $23 billion.
Key Support & Resistance Levels
ETH/USD
Support: $200, $193.50, $185.
Resistance: $212, $225.30, $235.15.
ETH/BTC:
Support: 0.021 BTC, 0.0202 BTC, 0.0198 BTC.
Resistance: 0.0218 BTC, 0.0223 BTC, 0.0232 BTC .
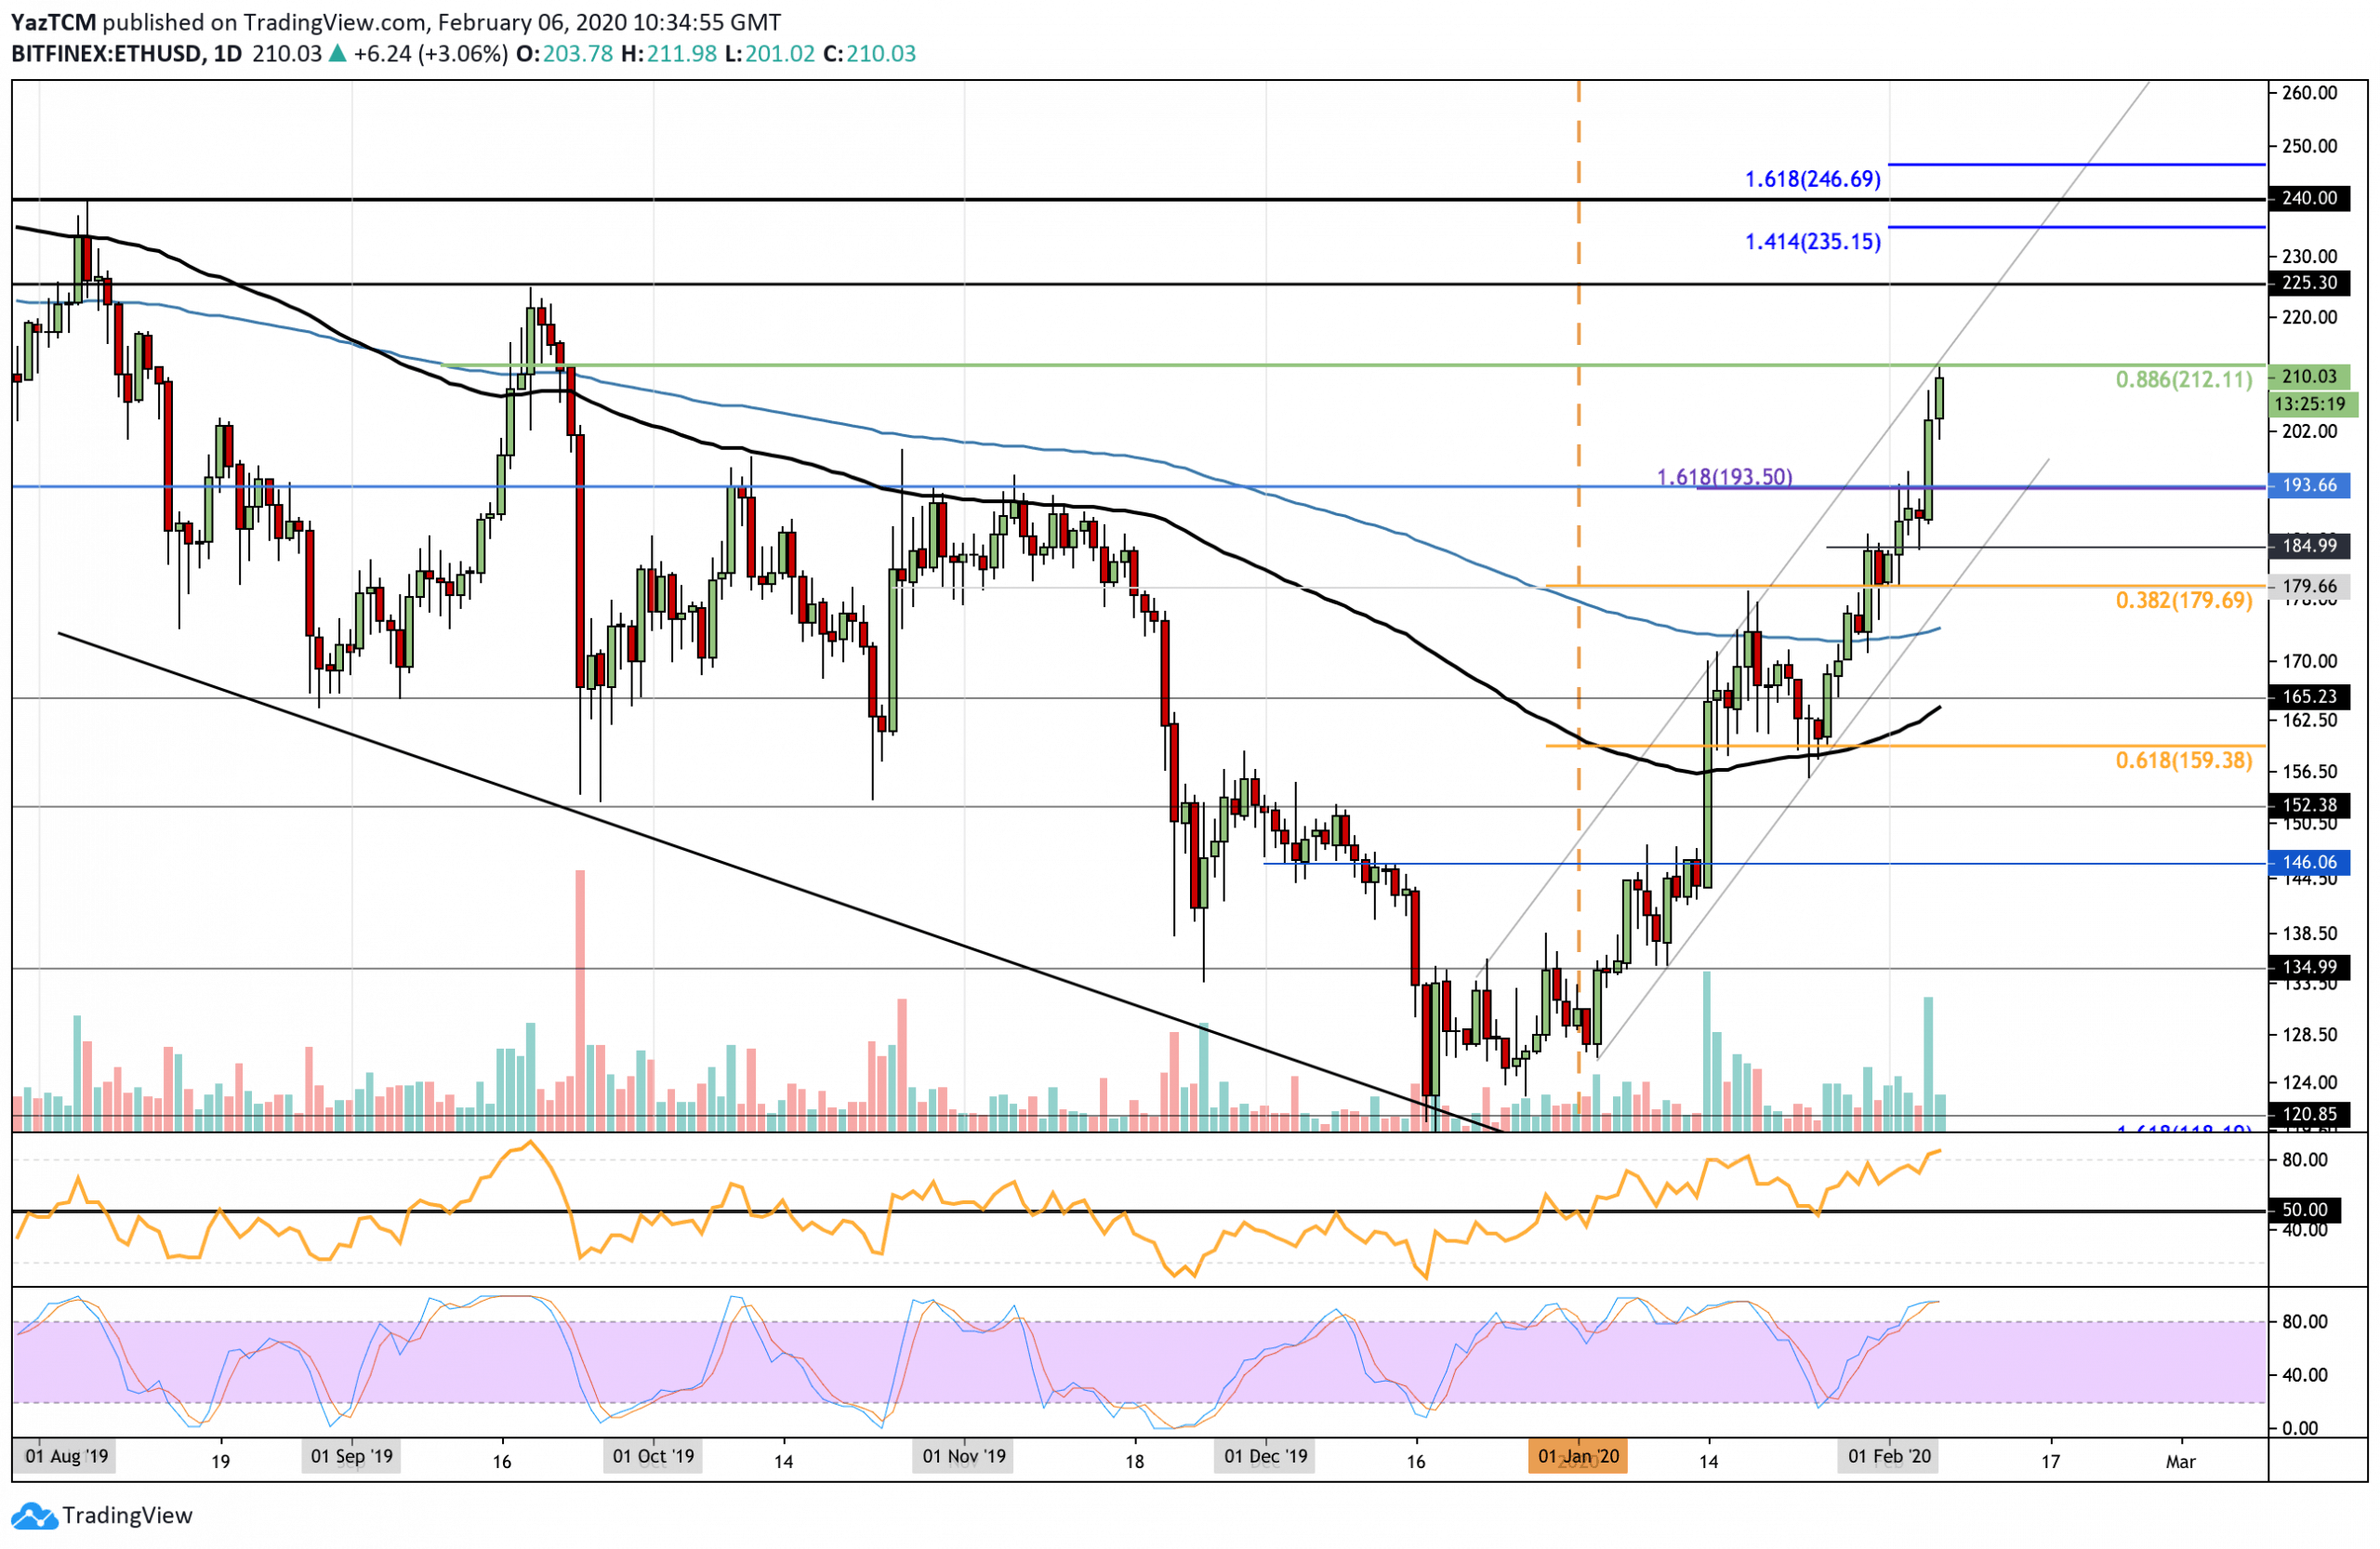
ETH/USD – Ethereum Breaks $200 For First Time Since September 2019
Since our last analysis, ETH managed to break above the previous resistance at $193.50 as it continued to climb higher toward $212. The resistance here is provided by a long term bearish .886 Fibonacci Retracement.
Ethereum continues to trade within the confines of the ascending price channel as it reaches resistance at the upper boundary. The latest break above $200 now gives it a fresh high that has not been witnessed since September 2019.
The cryptocurrency is strongly bullish with only a drop beneath the 200-days EMA at $175 breaking this trend.
Ethereum Short Term Price Prediction
If the buyers continue to bring the price up above the $212, higher resistance is located at $225. Above this, resistance lies at $235.15 (1.414 Fib Extension), $240 (August 2019 highs), and $246 (1.618 Fib Extension).
On the other hand, if the sellers push ETH lower, the first level of support is located at $200. Beneath this, additional support is found at $193, $185, and $180 (.382 Fibonacci Retracement level). Added support is then found at $175 where lies the 200-days EMA.
The RSI is still above the 50 level as the bulls continue to dominate the market momentum. It is a little overextended, which should warn traders to remain cautious. However, the RSI is well-known to stay overbought for long periods when the market turns parabolic.
ETH/BTC – ETH Breaks 4-Month Descending Trend Line And Climbs Above 200-Days EMA
Ethereum managed to break above the 4-month old descending trend line against Bitcoin as it breached the resistance at 0.0204 BTC. It went on to climb and break above the 200-days EMA at 0.021 BTC to reach higher resistance at 0.0218 BTC – where it currently sits.
The market remains firmly bullish, especially after breaking above the 6-week old rising trend line. ETH would need to drop beneath the support at the 100-days EMA to reverse this bullish trend.

Ethereum Short Term Price Prediction
Moving forward, if the buyers bring ETH above 0.0218 BTC, the first level of strong resistance lies at 0.0223 BTC (bearish .382 Fib Retracement). Above this, resistance lies at 0.023 BTC, 0.0232 BTC (1.414 Fib Extension), and 0.0239 BTC.
Alternatively, if the sellers step in and push ETH lower, the first level of support lies at 0.021 BTC (200-days EMA). Beneath this, support is found at 0.0202 BTC, 0.0198 BTC, and 0.019 BTC.
Similarly, the RSI has reached extremely overbought conditions to indicate that the bulls may be slightly overextended. Additionally, the Stochastic RSI is also primed for a bearish crossover signal that could send the market lower.
Disclaimer: Information found on CryptoPotato is those of writers quoted. It does not represent the opinions of CryptoPotato on whether to buy, sell, or hold any investments. You are advised to conduct your own research before making any investment decisions. Use provided information at your own risk. See Disclaimer for more information.
The post appeared first on CryptoPotato


