
Is the bottom in? Since Bitcoin (BTC) fell precipitously to $6,600 late last month and $6,400 just days ago, analysts have been asking if the leading cryptocurrency has finally found a price bottom after a multi-month downturn.Related Reading: Eat My Shorts: Everything You Need To Know About The Bitcoin Bart PatternAnalysts have understandably divided over the question, as the correct answer would show in which direction Bitcoin will head for the next couple of months. Per a continually-growing number of prominent traders, there is a high likelihood that the bottom is in. Here’s more on why.Did BTC Bottom At $6,400?Analyst Mexbt recently remarked that “there is a very high chance that the Bitcoin bottom is in,” drawing attention to the below chart, which shows that BTC’s chart has posted strong rebounds after interacting with the key historical horizontal support of $6,400. This, some analysts would say, marks a swing failure pattern that should favor bulls on a longer-term time frame.I think there is a very high chance that the Bitcoin bottom is in. pic.twitter.com/478nKFcbfl— mexbt (@stackxbt) December 24, 2019It isn’t only Mex that believes the Bitcoin bottom is in per simple charting techniques.Prominent trader SmokeyXBT recently posted the chart below on Twitter, remarking that if $6,400 “was the generational Bitcoin bottom, it was the most perfect bottom to ever be formed.”Indeed, the chart he attached to this message shows that BTC bounced off a macro established support of the 2018 bear market, which coincided with the lower bound of a six-month-long descending channel — these being clearly bullish signs.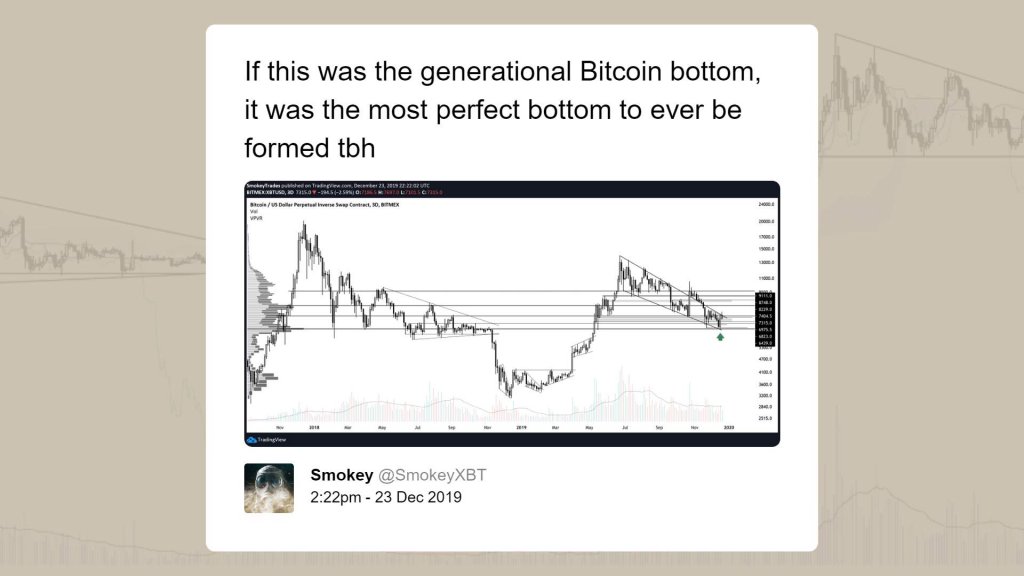 That’s not to mention that as reported by NewsBTC earlier this week, miner capitulation purportedly ended.The reversal of the miner capitulation comes on the back of cryptocurrency data sites registering that the Bitcoin network’s hash rate recently hit an all-time high, seemingly reverting the capitulation that was taking place.What’s notable about the “recovery” signal flashing is that this very signal marked a series of previous macro bottoms in Bitcoin’s price history.Related Reading: This Simple Indicator Implies Bitcoin Price is Nearing Macro BottomBitcoin Metrics Corroborate Bottom ThesisIt isn’t only the charts that are favoring a Bitcoin bottom.Per previous reports from this outlet, on-chain market intelligence firm Glassnode recently observed that there is a confluence of factors suggesting that the Bitcoin bottom is forming, if not here already.Glassnode pointed out that the Market Value to Realized Value (MVRV), the ratio between market cap and realized cap, is “consolidating towards one,” which implies that gains are being realized by Bitcoin investors. A reading of “one” of the ratio often marks a bottom for the cryptocurrency market.There’s also Willy Woo, partner of Adaptive Capital, who recently remarked that on-chain momentum is “crossing into bullish” territory after a multi-month downturn. With this in mind, he asserted that the “bottom is most likely in,” meaning that any move lower than the $6,500 plunge “will be just a wick in the macro view.”On-chain momentum is crossing into bullish. Prep for halvening front running here on in. Can’t say what this indicator is, as it’s proprietary to @AdaptiveFund, but it tracks investor momentum. The bottom is mostly likely in, anything lower will be just a wick in the macro view. pic.twitter.com/WqiPRpweUv— Willy Woo (@woonomic) December 7, 2019Related Reading: Same Bitcoin Price Signal That Preceded 330% Jump Flashes AgainFeatured Image from ShutterstockThe post appeared first on NewsBTC


