
- NEO recovered 7% losses overnight following an increased volume from the bull’s sides.
- Technical indicators continue to flag bullish despite price drops over past days
- Against Bitcoin, NEO price remains inside wedge boundary as more gains seem underway
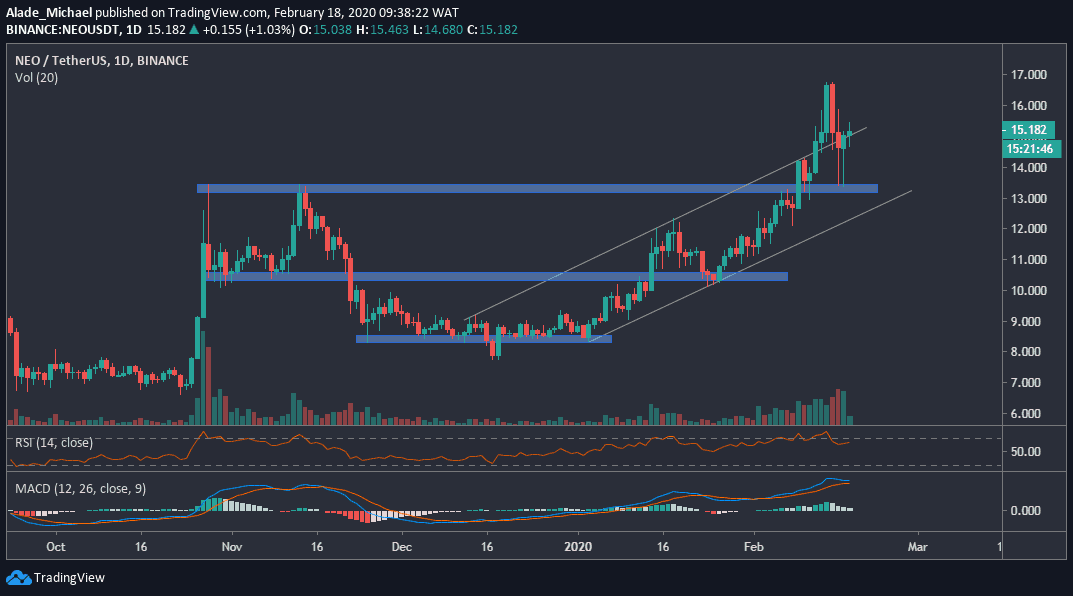
NEO/USD: NEO Bounces Back After Testing Key Support
Key Resistance Levels: $16.7, $18
Key Support Levels: $13.4, $10.5

NEO/USD. Source: TradingView
During the last three days, a correction caused a lot of panic amongst traders, following the massive loss in the price of NEO. This major correction cut NEO’s price by 15% to test the blue support area of $13.4 – November 2019 high that was broken during the last week of trading.
As a result of this, NEO traded back inside the rising channel after the breakout but is now trading slightly above this channel after seeing a sharp bounce from the blue zone yesterday.
Despite the recent drops, NEO is still up by 90% over the last seven weeks. Against the US Dollar, NEO is changing hands around $15.14, following a 7.02% gains overnight. We can anticipate more gains if the volume expands to the upside in the next couple of days.
NEO Price Analysis
Yesterday, NEO bounced off a crucial support zone at $13.4 after witnessing a significant drop. This reveals that buyers are showing interest again. NEO is now moving out of the channel with the support of a bullish pin bar.
If this bullish pattern plays out, NEO is likely to reclaim $16.7 before creating a fresh high around $18.On the downside, NEO is supported by the blue zone of $13.4. If the bearish correction continues and this support fails to hold, the next support to watch is $10.5 – right below the rising channel.
The technical MACD indicator shows that the buyers are still present in the market. Though the daily RSI has dropped below the 70 levels to reflect the recent price drops, but remains bullish. However, the mid-term bullish rally remains valid on the daily chart.
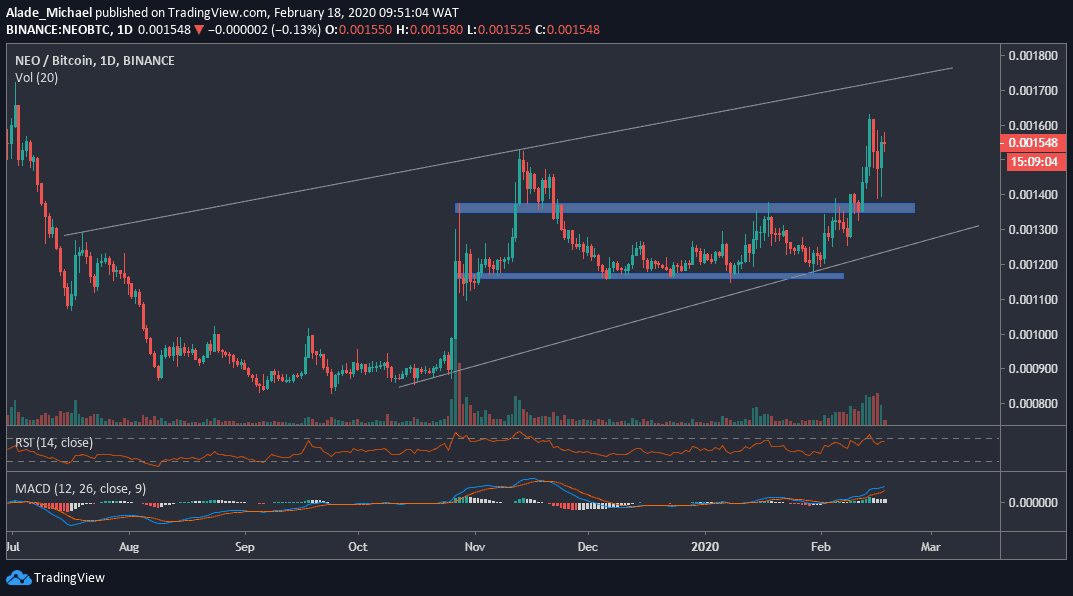
NEO/BTC: NEO Continues Trading Inside Wedge Boundary As Buyers Target 170000SAT Level
Key Resistance Levels: 162000SAT, 170000SAT
Key Support Levels: 137800SAT, 117000SAT

NEO/BTC. Source: TradingView
Against Bitcoin, NEO is following a bullish trend but has similarly seen a lot of correction over the past few days. Although the NEO/BTC pair has witnessed a small recovery of 7.22% over the last 24-hours.
This recovery came after dipping to near the blue support area of 137800SAT, as shown on the daily chart. Following the latest increase, NEO is now priced around 154800SAT level against the Bitcoin pair. This current growth seems to have brought a sigh of relief in the market and, at the same time, rekindled the bulls’ hope.
If NEO continues to gain momentum, the price is expected to reach 170000SAT resistance level – around the upper boundary of the wedge that was forming since July 2019. In case the price drops again, the 140000SAT level could provide support for NEO one more time.
NEO Price Analysis
NEO is still looking bullish despite experiencing a notable drop some days back. We can see that the trading volume is still significant. More so, the price is rising again. In this case, the next resistance level to consider here is 162000SAT, followed by170000SAT around the wedge’s upper boundary.
A significant break above this wedge could fuel a huge buying pressure. If the price drops, however, the closest support here is the 137800SAT level. A further bearish could dip NEO’s price into the lower blue support area of 117000SAT, below the wedge.
Nonetheless, NEO remains bullish on the RSI indicator and similarly forming a bullish pattern on the MACD indicator. Technically, this suggests that the bullish momentum has not yet finished.
Click here to start trading on BitMEX and receive 10% discount on fees for 6 months.
Disclaimer: Information found on CryptoPotato is those of writers quoted. It does not represent the opinions of CryptoPotato on whether to buy, sell, or hold any investments. You are advised to conduct your own research before making any investment decisions. Use provided information at your own risk. See Disclaimer for more information.
The post appeared first on CryptoPotato


