
Ripple price is facing a strong resistance near the $0.2900 and $0.2920 levels against the US dollar.Bitcoin price rallied recently and even broke the $10,600 and $10,800 resistance levels.Yesterday’s highlighted bullish trend line is active with support near $0.2750 on the hourly chart of the XRP/USD pair (data source from Kraken).The pair could decline a few points, but it remains supported above $0.2700.Ripple price is currently correcting gains from $0.2920 against the US Dollar, while bitcoin jumped above $10,800. XRP price is likely to climb sharply if it clears the $0.2920 resistance.Ripple Price AnalysisYesterday, we saw a decent recovery in XRP price above the $0.2700 resistance against the US Dollar. The XRP/USD pair even climbed above the $0.2800 resistance and settled above the 100 hourly simple moving average. It opened the doors for more gains above the $0.2850 level. More importantly, there were decent gains in other altcoins, including Ethereum, EOS and litecoin.However, ripple price faced a strong resistance near the $0.2900 and $0.2920 levels. A swing high was formed near $0.2918 and the price recently started a downside correction. It broke the $0.2850 support plus the 23.6% Fib retracement level of the recovery from the $0.2618 low to $0.2918 high. Finally, the price found support near the $0.2750 and $0.2760 levels.Additionally, the price found support near the 50% Fib retracement level of the recovery from the $0.2618 low to $0.2918 high. More importantly, yesterday’s highlighted bullish trend line is active with support near $0.2750 on the hourly chart of the XRP/USD pair. The 100 hourly SMA is also following the trend line and is currently near $0.2720. Therefore, dips towards the $0.2750 and $0.2720 levels remain attractive to the bulls.On the upside, the main resistances are near $0.2900 and $0.2920. An immediate resistance is near $0.2880 and a connecting bearish trend line on the same chart. A convincing close above the $0.2920 level might start another upward move towards the $0.3000 and $0.3050 levels. An intermediate resistance is near the $0.3020 level.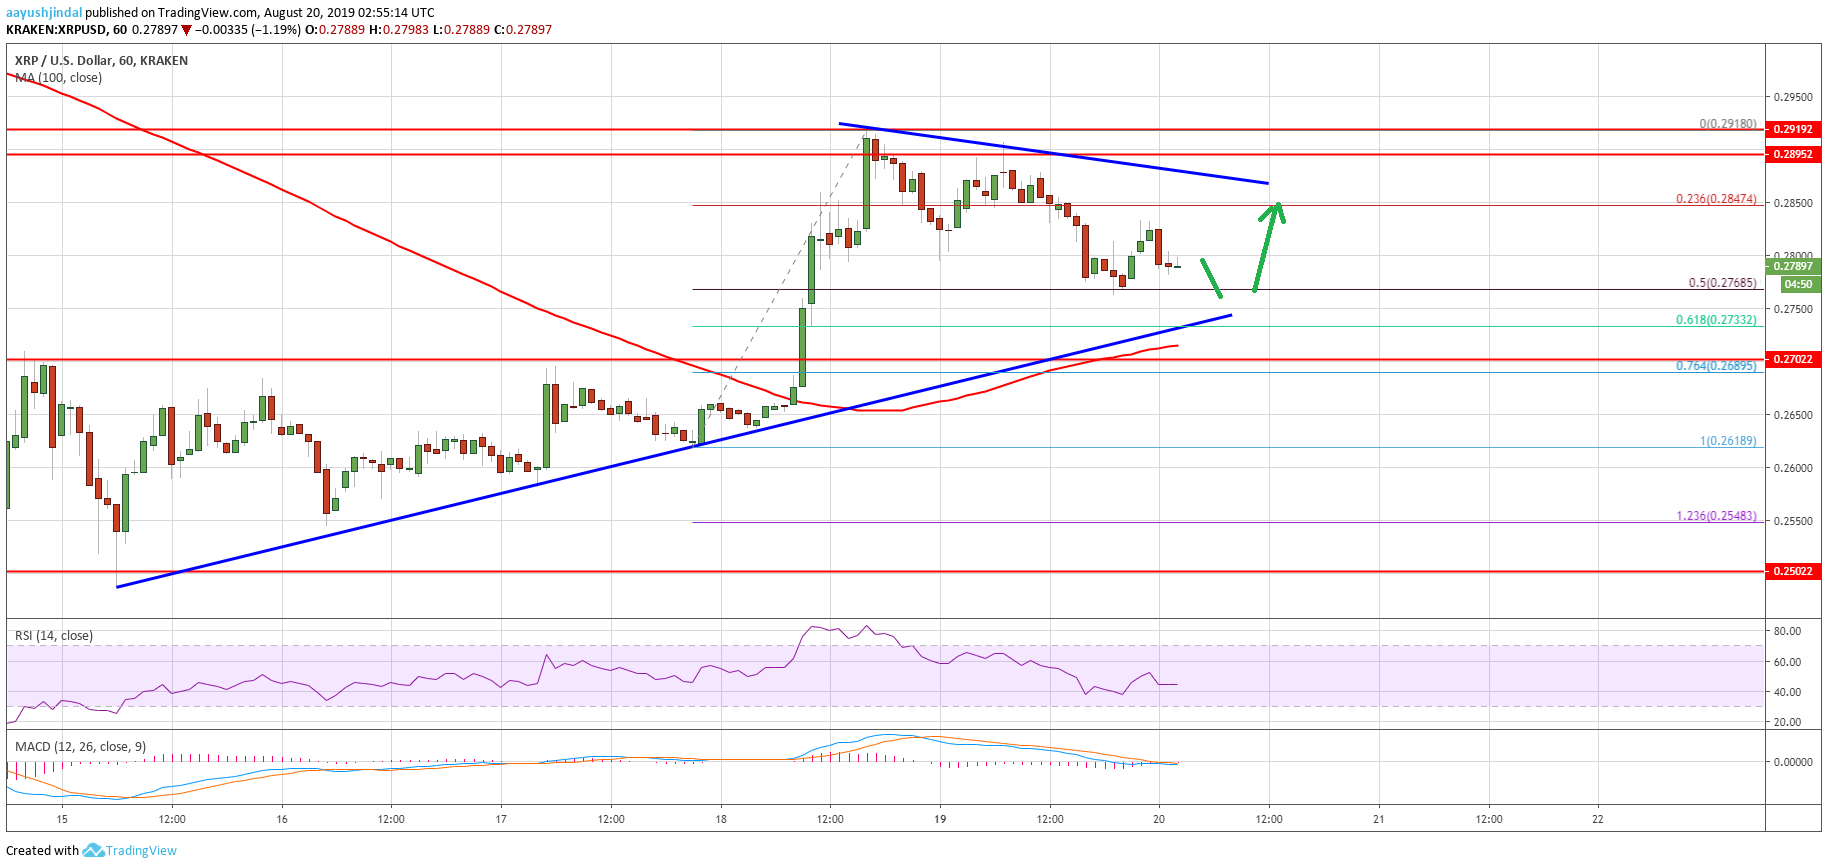 Looking at the chart, ripple price is currently trading nicely above the $0.2750 and $0.2720 support levels. Therefore, there are chances of a fresh increase above the $0.2880 and $0.2920 resistance levels. Conversely, a successful hourly close below the $0.2700 support might negate the current bullish view in the coming sessions. The next key support is near the $0.2550 level.Technical IndicatorsHourly MACD – The MACD for XRP/USD is about to move back into the bullish zone.Hourly RSI (Relative Strength Index) – The RSI for XRP/USD is currently just below the 50 level.Major Support Levels – $0.2750, $0.2720 and $0.2700.Major Resistance Levels – $0.2900, $0.2920 and $0.3000.The post appeared first on NewsBTC


