
- Tezos is resurging as the bearish head-and-pattern may invalidate.
- Tezos is following the same bullish pattern against Bitcoin and the US Dollar.
- XTZ is now relying on immediate support to face bullish in the long-term.
XTZ/USD: Bullish Pattern Still Shaky as XTZ Forms Inverse H&S Pattern
Key Support Levels: $1.24, $1.08
Key Resistance Levels: $1.55, $1.85
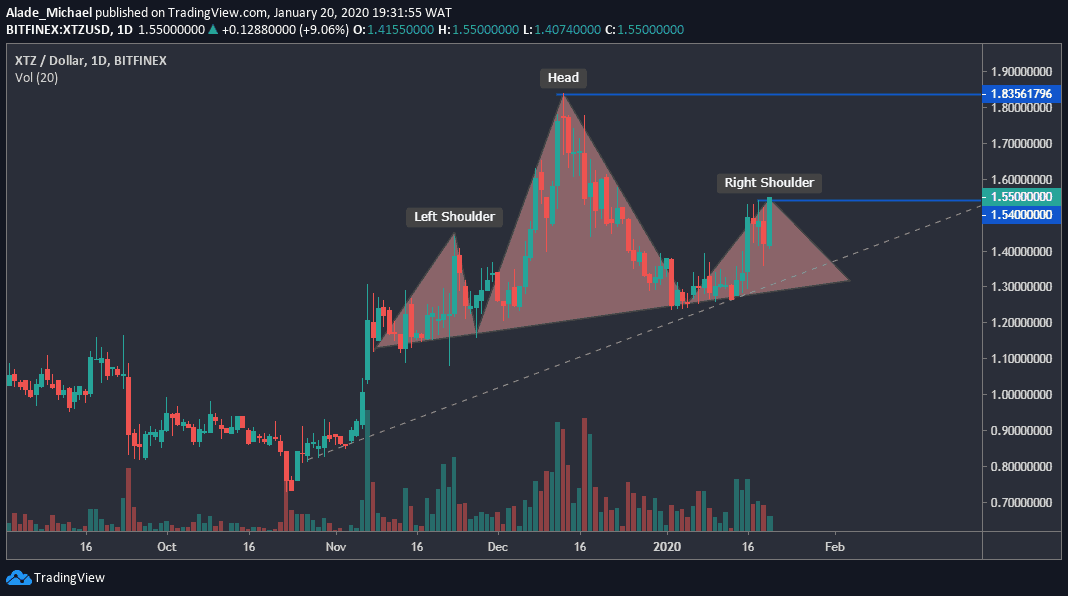
Earlier this month, Tezos managed to find support at $1.24 after falling from the $1.85 mark in December 2019.
Following the recent recovery, XTZ price ‘got stuck’ after touching to around $1.55 during last week’s trading. Now, the market seems to be gaining momentum back after seeing a small downward correction.
Tezos Short-Term Price Analysis
On the daily chart, Tezos is almost completing a head-and-shoulders pattern, but the ongoing bullish action may invalidate the pattern.
More notably, a notable daily candle close above the $1.55 resistance would confirm this bearish pattern invalid. The next resistance would be $1.85.
Apart from the bearish head-and-shoulder pattern, Tezos is supported by the dotted rising trend line that is drawn from October 2016 low. This may give more strength to the current bullish momentum. However, in case XTZ price rejects and fails to close above this resistance mentioned above, then the H&S pattern is likely to cause a lot of pain to the bulls if it plays out. $1.24 and $1.08 support may then face a massive sell-off. But currently, it appeared the bulls are showing much commitment.
XTZ/BTC: Tezos is Footing Strong Bullish Momentum
Key Support Levels: 14805 SAT, 12600 SAT
Key Resistance Levels: 19314 SAT, 24552 SAT
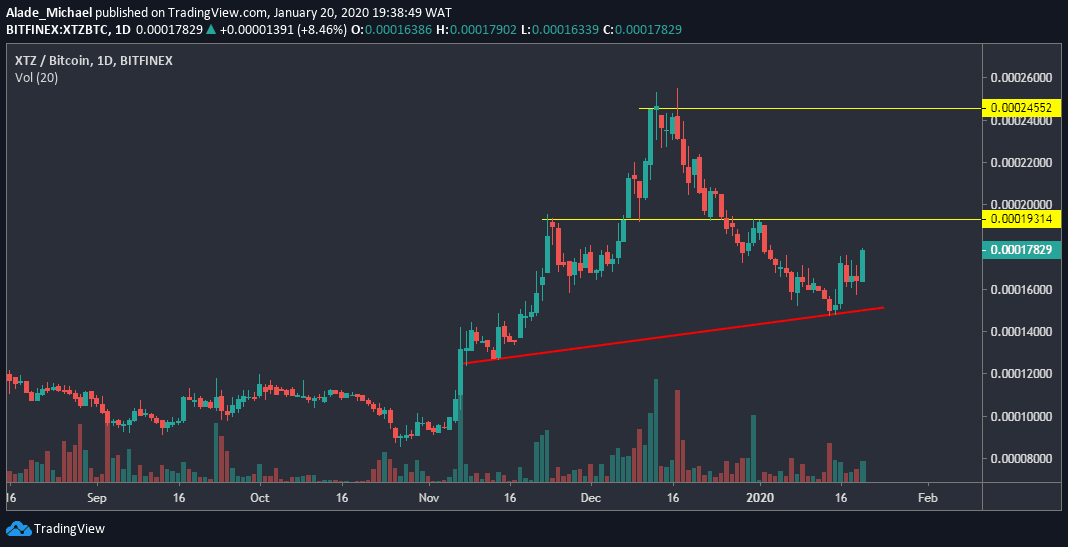
After witnessing a six weeks correction, last week, Tezos found significant support around the 14805 SAT level. At the moment, XTZ is up by 8.5% over the past 24-hours of trading. A More positive move should be expected in the coming days if buyers keep stepping into the market. Otherwise, the XTZ bearish momentum may regain control.
Tezos (against Bitcoin) Short-Term Price Analysis
Tezos is just footing a bullish formation on the daily chart. Although the bullish play would become more significant if the price can surpass the immediate resistance at the 19314 SAT level.
The next few days of trading would tell whether the bulls have finally resumed or not. However, buyers are aiming for the 19314 SAT as of writing this. Additionally, intense buying pressure could reach 24552 SAT levels in future trading.
Zooming at the price chart, we can see that the trading volume is still despite the ongoing bullish sentiment.
Should the trading volume continue to stay insignificantly, the price of XTZ is likely to roll back down to the red trend line. A steep drop below this trend line could cause Tezos to find a floor at 14805 SAT and 12600 SAT. Looking at the market structure, XTZ/BTC is short-term bullish.
Disclaimer: Information found on CryptoPotato is those of writers quoted. It does not represent the opinions of CryptoPotato on whether to buy, sell, or hold any investments. You are advised to conduct your own research before making any investment decisions. Use provided information at your own risk. See Disclaimer for more information.
Cryptocurrency charts by TradingView.
Technical analysis tools by Coinigy.
The post appeared first on CryptoPotato


")

