
The future belongs to those who prepare for it, and the long term of XRP demands preparation for a fall. The coin’s performance in the bull’s market has been bearish and with the fall of Bitcoin, the coin also registered a fall on August 14.
Despite several tries, no relief was in sight for the coin. Short-term chart predicts the price of the coin to slump further, before recovering. However, long-term prediction notes the formation of a Descending Triangle formation.
Long-term
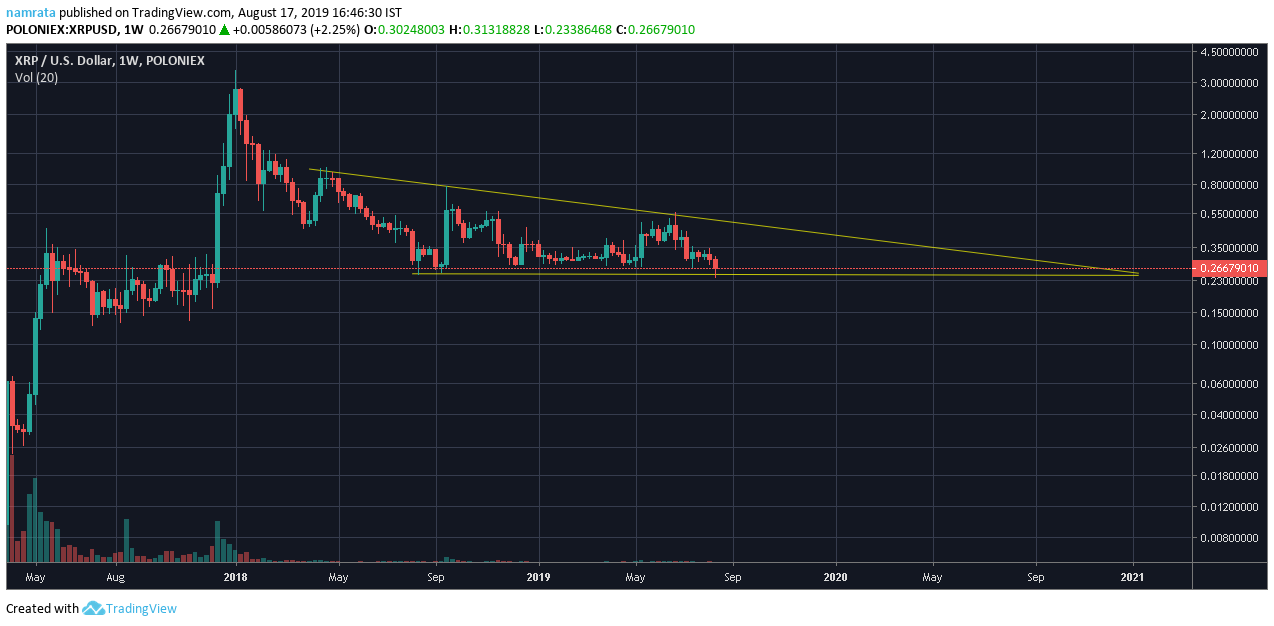
Source: Trading view
The long-term chart of XRP marks the price of the coin falling slowly overtime forming lower highs, while there were a series of lows noted at the same time. This constant fall in the highs of the coin and series of lows contributed to the formation of a descending triangle, pointing towards an imminent breakout. However, since it’s a long term prediction the breakdown can be observed only by 2021.
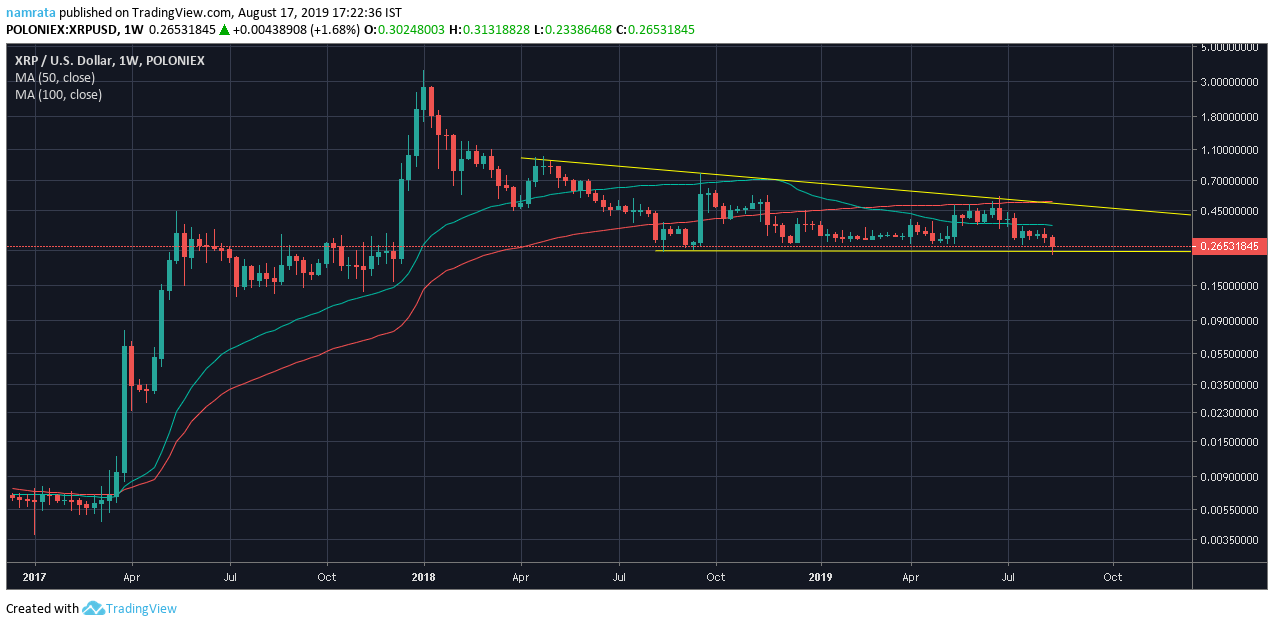
Source: Trading view
The 50-weekly [green] moving average has remained above the 100-weekly [red] moving average since March 2017, however, the recent change in events has caused the 100-weekly moving average taking a lead, marking a bearish run. The 100-weekly moving average crossed the 50-weekly average line and aligned above the candlesticks which are an indication of an approaching bear.
The post appeared first on AMBCrypto


