
Ethereum is down more than 6% and it broke the key $140 support area against the US Dollar.The price tested the final bearish target near the $132 and $130 levels.There is a short term contracting triangle forming with resistance near $133 on the hourly chart of ETH/USD (data feed via Kraken).The price could correct higher, but it is likely to face sellers near $136 or $138.Ethereum price is diving below key supports versus the US Dollar and bitcoin. ETH price could continue to move down towards $125 if it fails to stay above $130.Ethereum Price AnalysisIn the past few analyses and the weekly forecast, we discussed the chances of Ethereum declining to the $132 support against the US Dollar. ETH price did start a nasty declining in the past few sessions and broke many supports near $140.Moreover, there was a close below the $140 level and the 100 hourly simple moving average. It opened the doors for more losses and the price tumbled below the $135 level. Finally, it spiked below the $132 support and tested the $130 area.A new monthly low was formed near $130 and the price is currently consolidating losses. An initial resistance is near the 23.6% Fib retracement level of the recent decline from the $142 high to $130 low.Besides, there is a short term contracting triangle forming with resistance near $133 on the hourly chart of ETH/USD. Therefore, Ethereum price could either recover above $133 or extend its decline.On the upside, the next major resistance is near the $136 level. Additionally, the 50% Fib retracement level of the recent decline from the $142 high to $130 low is also near the $136 level.Having said that, the price must climb above the $138 and $140 resistance levels to move back into a positive zone. If not, there is a risk of more downsides below the $130 support area.A clear break below the $130 level will most likely open the doors for a nasty decline towards the $125 support or the $122 area in the near term.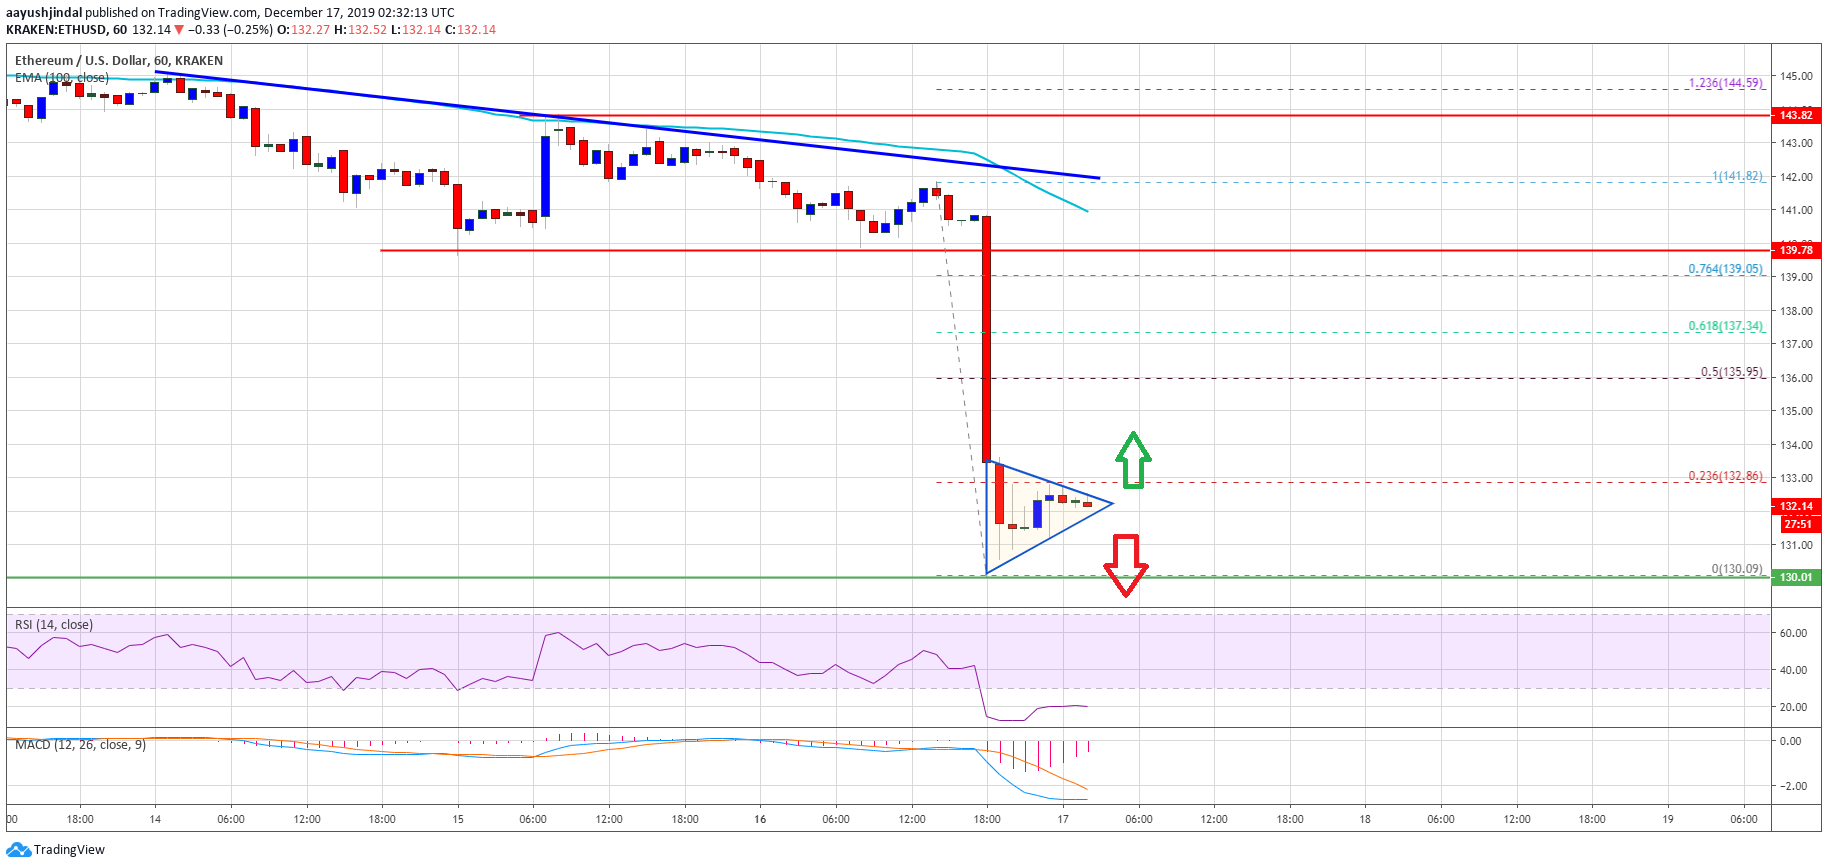 Ethereum PriceLooking at the chart, Ethereum price is down more than 6% and it clearly dropped heavily after it broke the $140 support. Similarly, there could be another slide if the price fails to stay above the $130 support area.ETH Technical IndicatorsHourly MACD – The MACD for ETH/USD is slowly reducing its bearish slope.Hourly RSI – The RSI for ETH/USD is currently in the oversold region, with no signs of a major recovery.Major Support Level – $130Major Resistance Level – $136The post appeared first on NewsBTC


