
Litecoin’s past 24-hour change does not mirror its recent bullish rally. The silver counterpart to Bitcoin registered a slump of 9.08 percent and its price held support just above $70. According to CoinMarketCap, its market cap remained under $4.5 billion at press time but the 24-hour trading volume remained positive and above $5.4 billion.
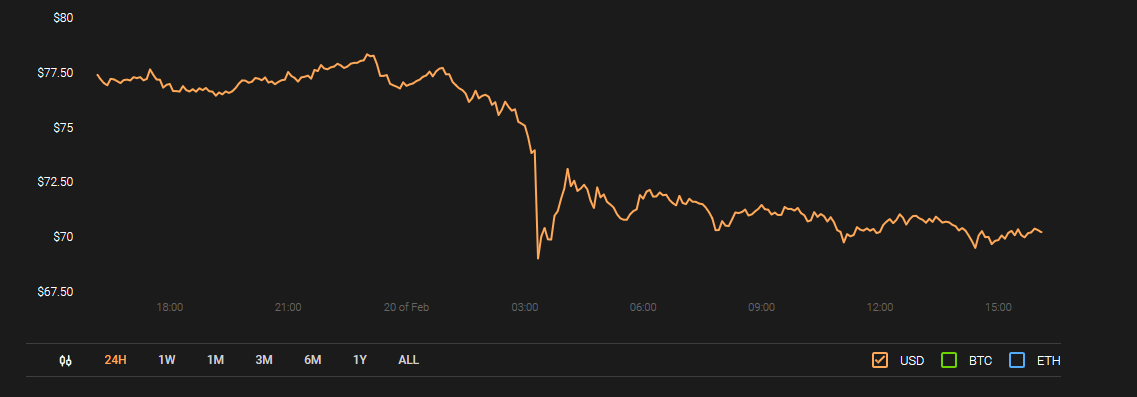
Source: CoinStats
Litecoin 1-day chart
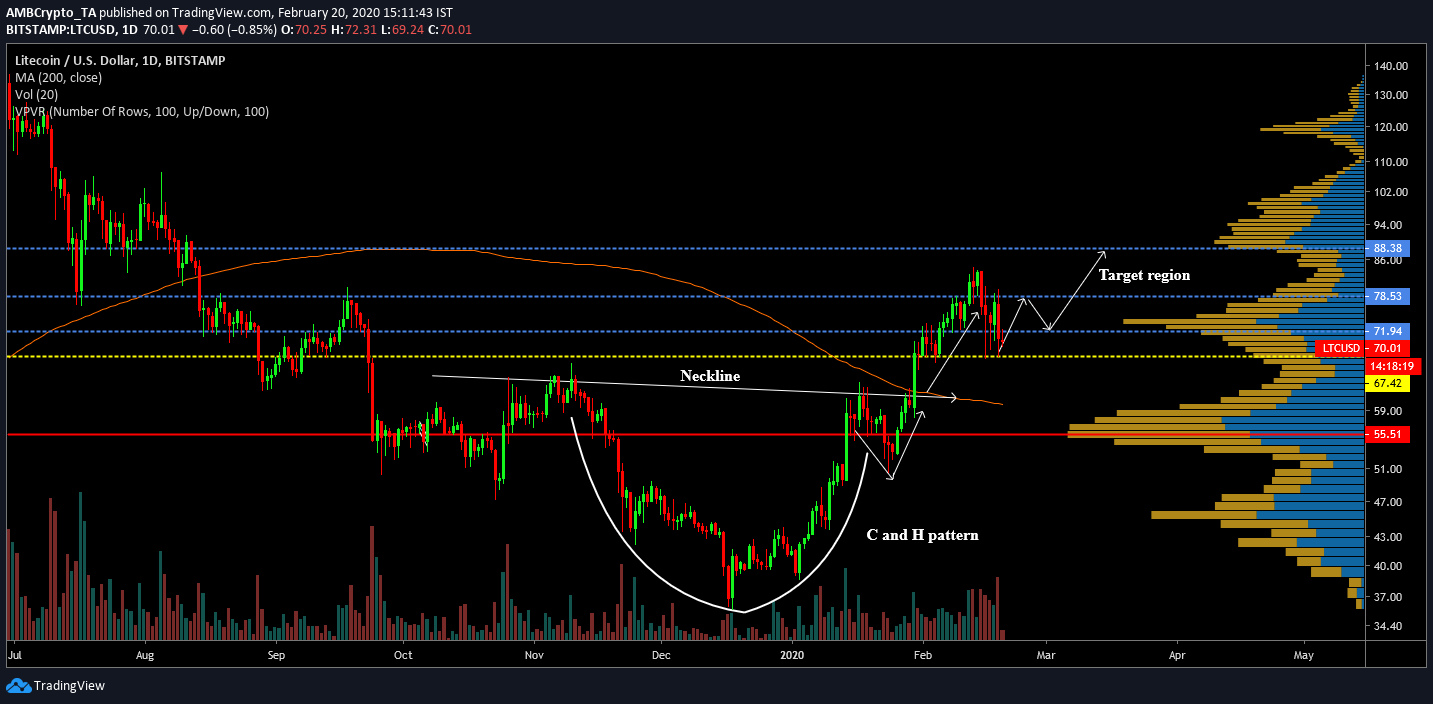
LTC/USD on Trading View
The 1-day chart of Litecoin indicated that the breakout on 30th January was due to the formation of a cup and handle pattern which started taking shape from the end of November 2019. A cup and handle pattern is a long-term bullish sign, which usually results in a strong move above the neckline once it is breached. The price followed a similar path after the breakout, which took its valuation above key resistances at $71.94 and $78.53.
However, over the last few days, Litecoin has faced correction. Since 15th February, Litecoin registered a dip of 20 percent which took its valuation from $83.45 to $67.37. From a market perspective, such a correction is deemed healthy for the long term bullish rally and over the next few weeks, Litecoin may consolidate between $71.94 and $78.53.
Registering a strong consolidation between that range should revitalize Litecoin’s rally to re-test long term resistance at $88.38. At press time, resistance at $78.53 was strong but another rally may allow Litecoin to gain movement above the $80 range.
According to the VPVR indicator, trading volume at $71.94 and $73.79 has been strong as well, indicating the strength of the resistance.
The 200-Moving Average remains a key support for the price, which suggested that the bullish sentiment is still active in the market.
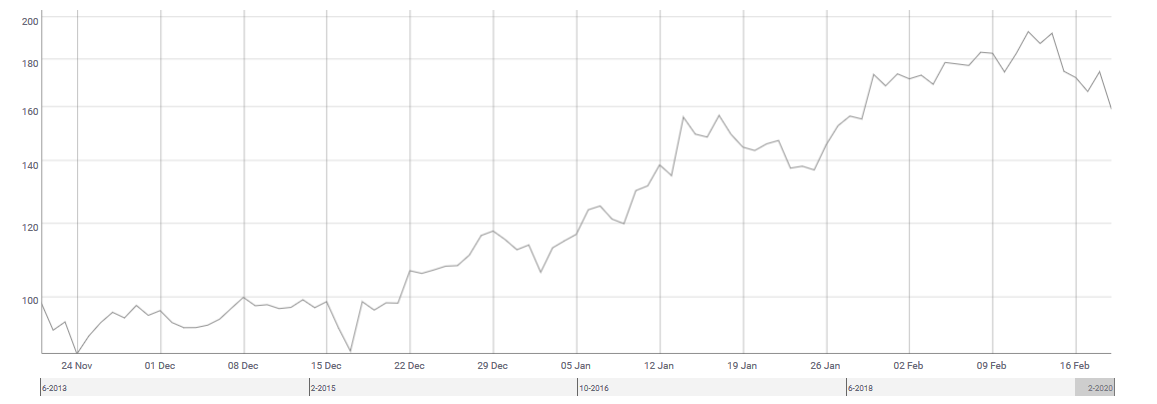
Source: CoinMetrics
According to CoinMetrics, Litecoin’s NVT recently registered a dip but since the start of 2020, the incline is pretty evident.
A higher NVT usually suggests that the network valuation of the token is outperforming the value being transmitted on the network. Whenever NVT reaches a higher rating, it usually indicates that investors are valuing the asset from a perspective of long-term growth.
Litecoin’s rising NVT ratio mirrors its overall performance in 2020 and it may play a bigger role over the next few weeks.
Conclusion
Litecoin’s recent correction below $70 can be a blessing in disguise for the token as it improves its chances of consolidating higher in charts during the next rally. Significant resistance will be faced at $78.56 but a march towards $88 should be possible by mid-March.
The post appeared first on AMBCrypto


