Halvings are important events in Bitcoin’s price cycle, especially because a lot of expectations are tied to these events. However, while Bitcoin’s price did end up higher post the first two halvings, it did take quite a few months for the price to do the same.
Post the first halving, the price rose by over 9000% in a year. From $12 in November 2012, it hit a peak of $1100 in November 2013. Following the second halving, it hiked by over 280% in 11 months. From $650 in July 2016, it breached $2500 in May 2017. The pre-programmed decrease in supply has driven demand and prices for two halvings now.
Post the third halving, the price has risen by 33% in four months. While we are still in the drawdown period following the historic meltdown of 2018, Bitcoin’s price has remained steady for the past 5 weeks.
Hence, the question arises – While Bitcoin continues to follow the post-halving trend in price, how can traders capitalize on this? Is there a right time for the Big Short? How much do you stand to gain, if you follow indicators on BTC’s price charts?
Traders can capitalize on this opportunity created by market cycles in many ways. One obvious way is to HODL through the halving. Buy dips pre-halving and HODL till the price climbs by over 50%. However, this is not an option for day traders. Day traders can read charts and can follow one or two indicators that would have predicted the price correctly, if used in the past. Bollinger Bands, SMA, and the 200-day SMA are just a few of the popular ones.
Using the 200-day SMA, predictions for post-halving cycles have been observed to be historically accurate. On the Bitcoin price chart, when the price falls below 200-day SMA, it dips further. This is a great opportunity for a short. Shorts are riskier as opposed to longs, but they also give higher gains.
Reward in shorting BTC > Risk in a short predicted using the 200-day SMA
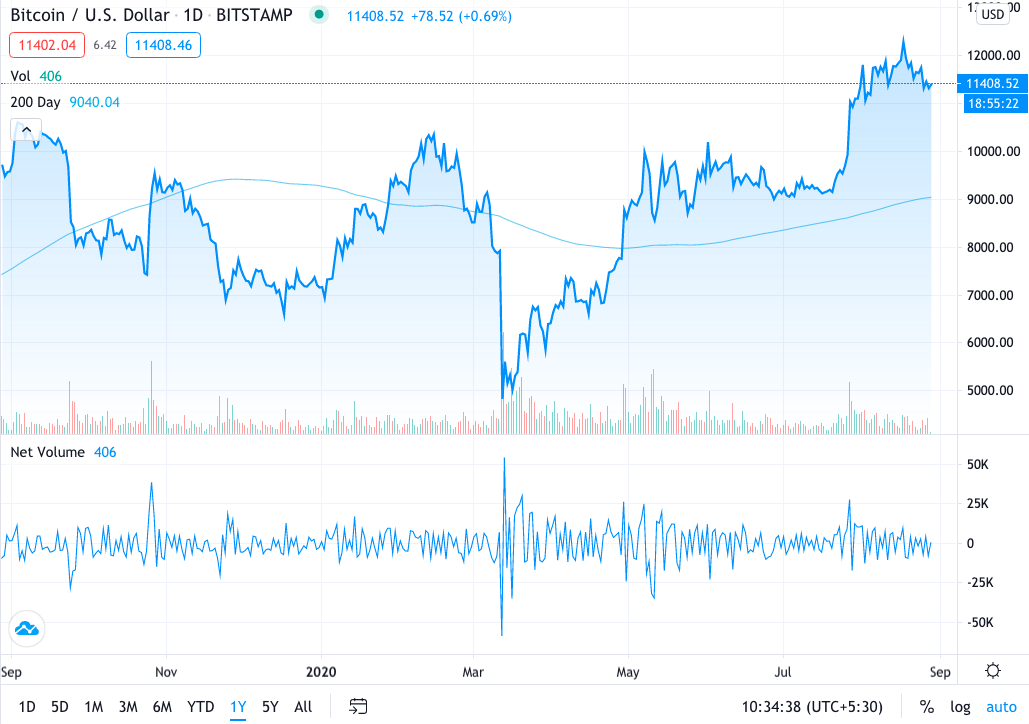
On the 1Y BTC price chart here, the price dropped below 200-day SMA a few times,
- Bitcoin’s price was $8342.73 on 25 September 2019. Within two weeks, it dropped to $7722 and within a month, it dropped to $7378. This was a drop of $964 in 30 days.
- On 7 November 2019, the price was $9169, following which, it dropped to $6827 within 2 weeks. This was a drop of over 25% in 15 days.
- On 8 March 2020, the price was $8687 and it dropped by over 44% within 4 days.


Source: TradingView
These were some of the most prominent opportunities to earn profits of as much as 44% within a week, 15 days, or a month. At the time of writing, Bitcoin’s price was well above the 200-day SMA. The next opportunity to short within this post-halving cycle will be when the price drops below the 200-day SMA.
Other indicators like Moving Average and Parabolic SAR are used for making predictions that are historically accurate too. However, the 200-day SMA is by far the most accurate one for shorting BTC.
If a day trader had invested $5000 on 25 September 2019 and shorted three times (reinvesting gains and excluding fees), the gains would be upwards of $4100. The portfolio would be valued at upwards of $9100, post the third short. Reinvesting $9100 on 12 March 2020 and HODLing would increase the value by upwards of 135% and the portfolio would be valued at a staggering $21476 today.
This shorting strategy has historically proven to be accurate. In the case where the price doesn’t go up by upwards of 50%, it is sure to go up by 20-25%. Barring the interest and fees paid to the exchange, traders can possibly make profits in less than two weeks following this strategy.
The post appeared first on AMBCrypto


