
Tesla is undoubtedly one of the most exciting and innovative companies to watch, especially in the past few months. Since October, its stock price has skyrocketed, surging upwards than 250%. However, technical indicators suggest that, currently, TSLA is more overbought than Bitcoin back in 2017’s cryptocurrency bubble.
Tesla’s Impressive Performance
Tesla is a well-known and innovative American automotive and energy company that’s based in Palo Alto, California. It specializes in manufacturing in electric cars and solar panels, mainly through its subsidiary, SolarCity.
The company is headed by the prominent entrepreneur Elon Musk who co-founded it and currently serves as the Product Architect and CEO.
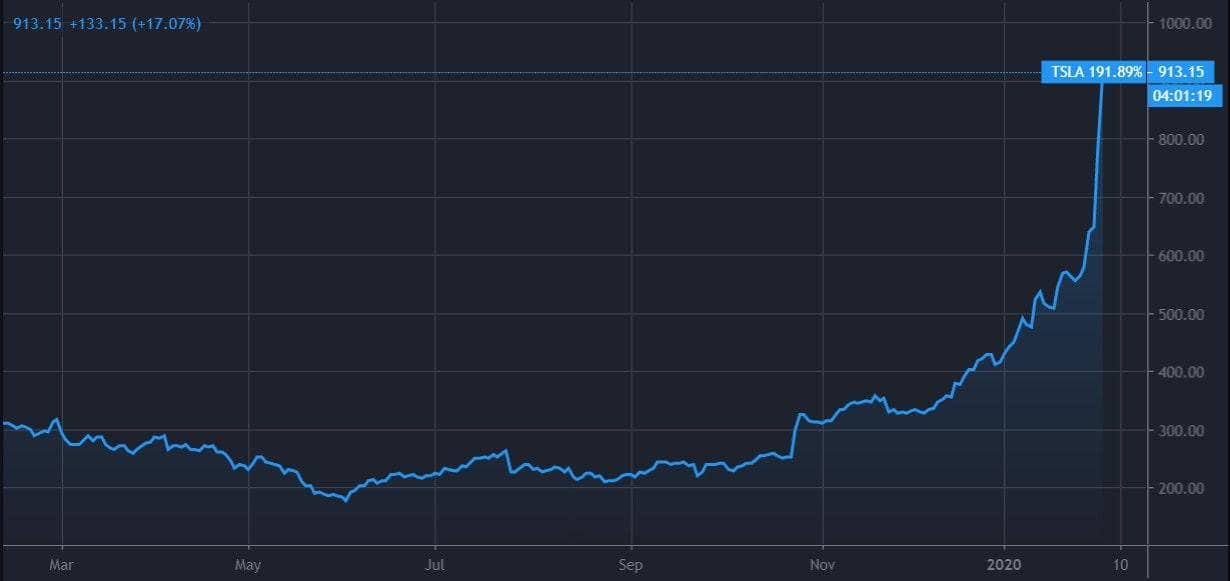
In the past few months, Tesla made headlines because of its impressive performance in the stock market. TSLA shares surged from about $250 towards the end of October 2019, to more than $900 at the time of this writing. This marks an impressive increase upwards of 250%.

TSLA Stock Price. Source: TradingView
Today alone, the price increased by another 16%, reaching about $905 per share. One of the reasons behind the most recent surge could be that Argus Research raised its price target for Tesla from $556 to $808, which is among the highest on Wall Street. It cited the company’s solid fourth-quarter results, as well as the rising sales of vehicles.
Another boost might have come from the fact that Ark Investment Management also updated its valuation model to reflect the upside potential of Tesla. According to the firm, its stock could be worth between $7,000 and $15,000 per share by 2024, in the best-case scenario.
TSLA Stock More Overbought Than Bitcoin
On another note, however, Tesla’s stock approached seriously overbought conditions today, February 4th. At one point during the day, the 14-day Relative Strength Index (RSI), stood at 92.5 for the automaker.
Comparatively, back in December 2017, when Bitcoin was at its absolute peak on top of the cryptocurrency bubble, the RSI didn’t break 91.
The RSI indicator is a gauge of the magnitude, as well as the persistence of price movements. An asset is considered to be overbought if the RSI is above 70 and oversold if it’s below 30.
In terms of technical analysis, when an asset is overbought, it usually means that it trades above its intrinsic value. This could be a signal that the price might be in for a correction soon.
The post appeared first on CryptoPotato


