
This article looks at candlesticks patterns, specifically bullish ones and why it’s important to have a good understanding of them for trading.
Previous articles covering chart patterns published to date include; the basics of chart patterns, guide to continuation patterns , the roles of triangles, and an article on trading cups and shoulders.
Bullish
Hammer
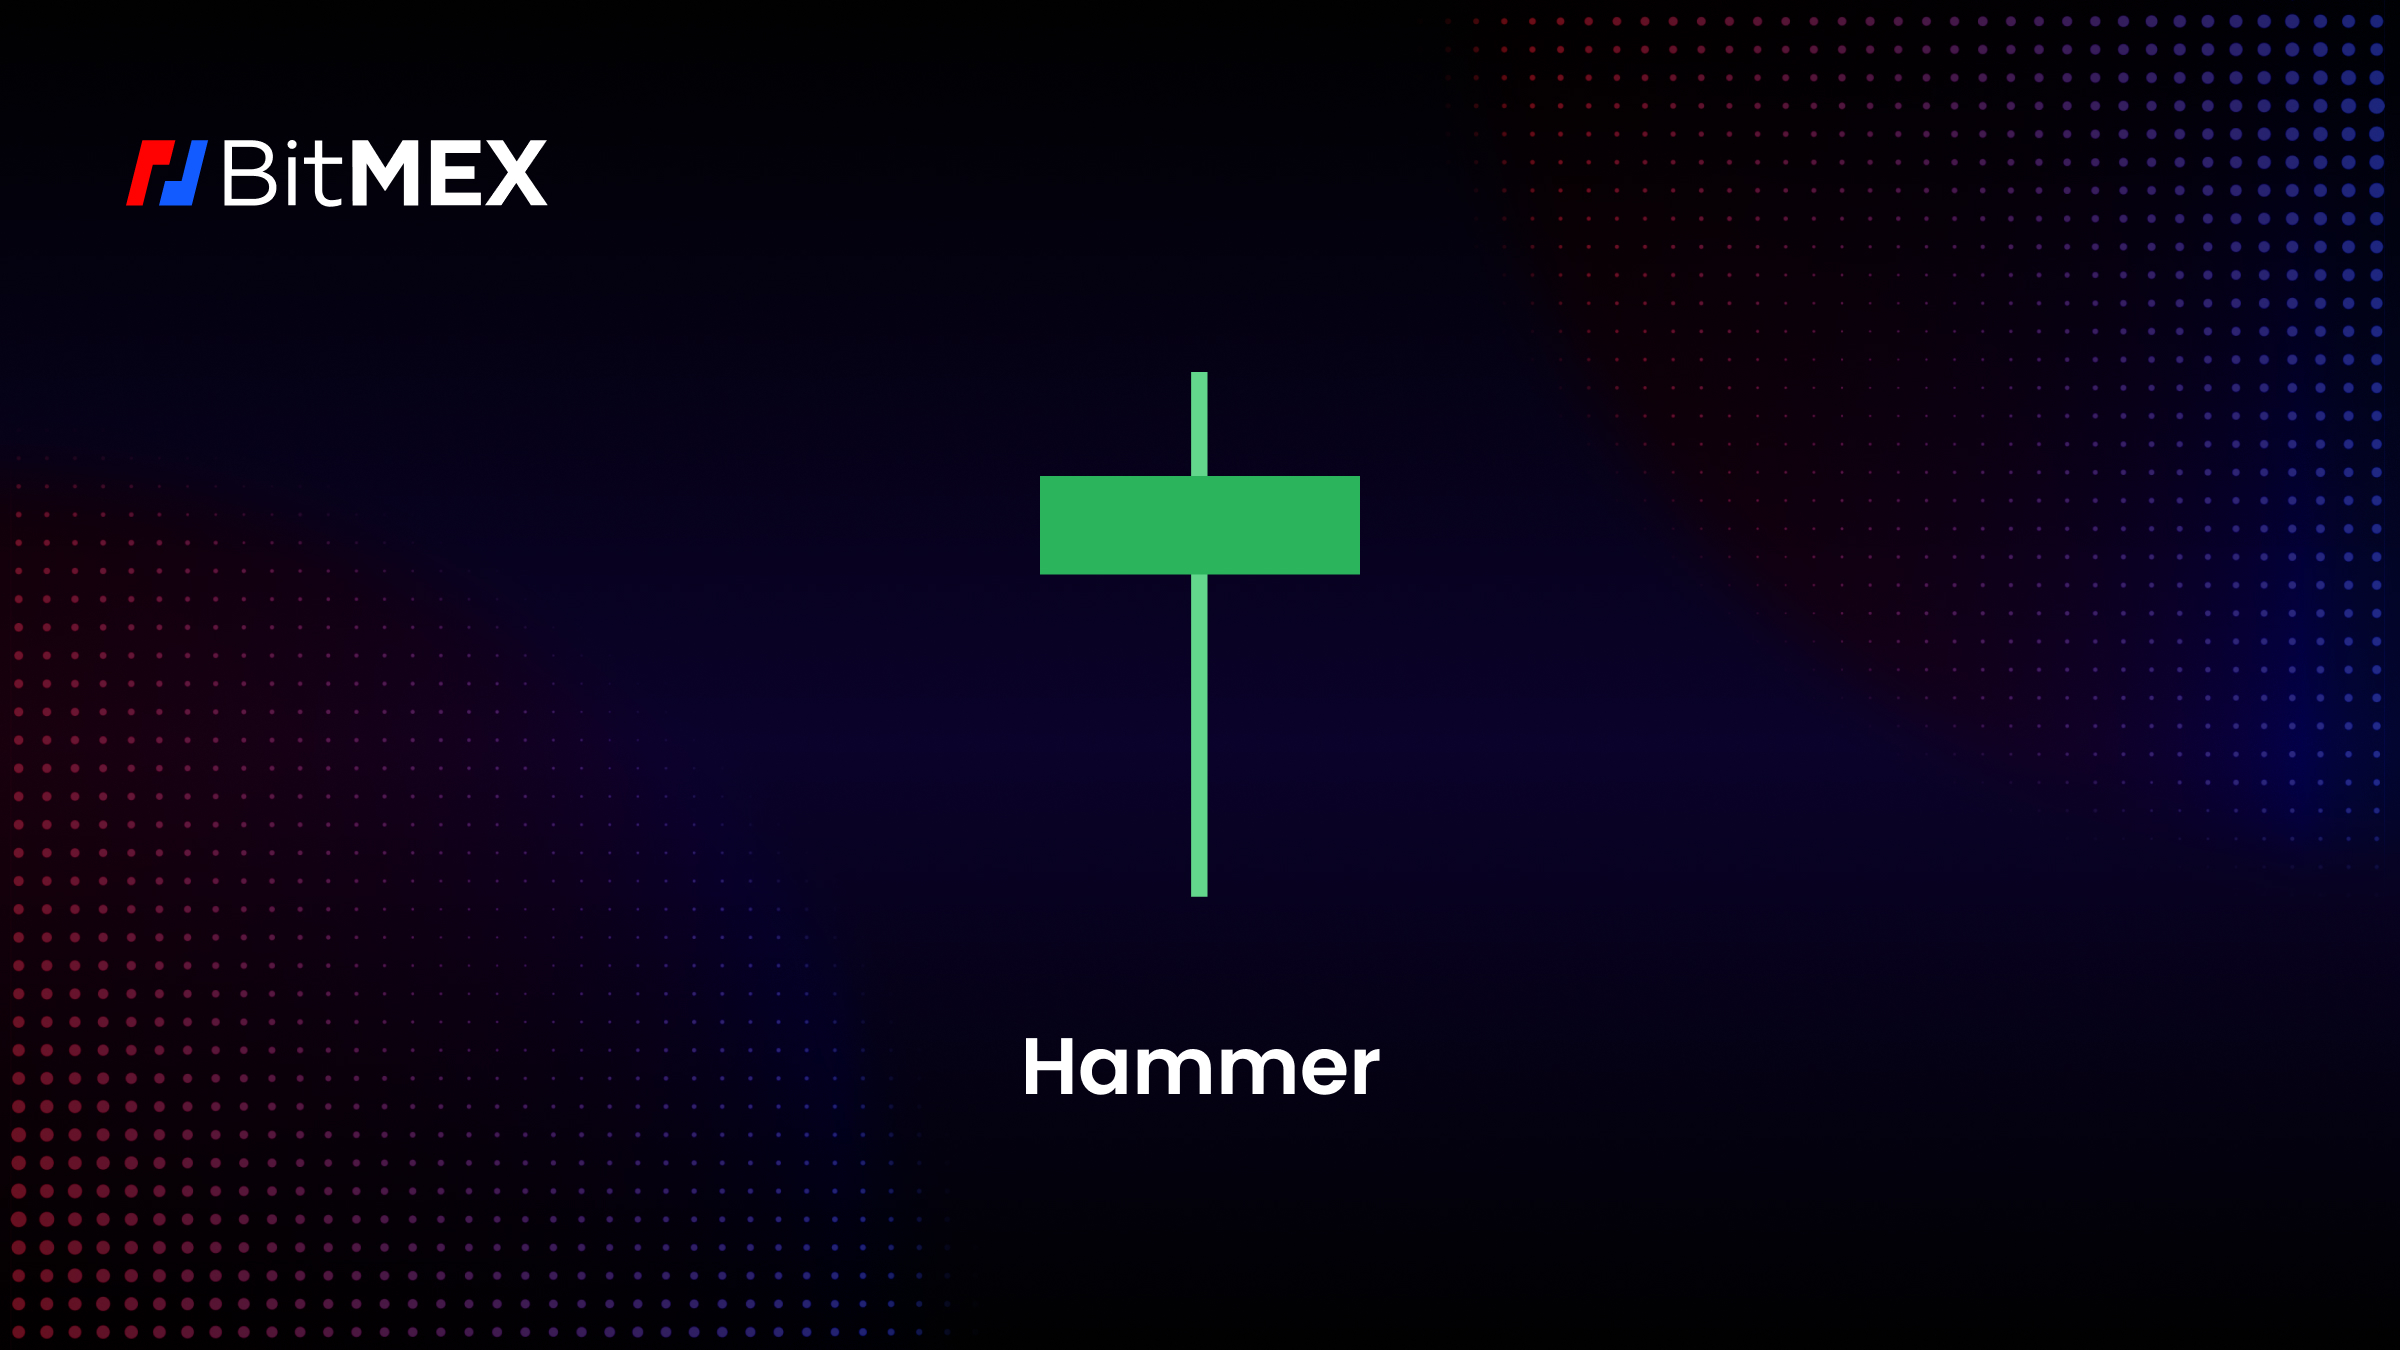
The Hammer pattern is a bullish candlestick and indicative of a possible trend reversal. The pattern is defined by a small, green coloured body at the top of the candle, and a long shadow, which resembles a hammer shape.
What are the Indicators of a Hammer Pattern?
- Seek out a candlestick with a small body only.
- Validate that the candlestick is green and hence closing price > opening price.
- Verify that the bottom shadow is noticeably longer than the actual body.
- Verify that the top shadow is either very brief or not present at all.
- Take into account the situation:
- The hammer pattern is most significant when it shows up following a downtrend.
- A hammer’s validity as a potential reversal indicator is increased when its body forms close to a strong support level.
How to Interpret the Hammer Pattern?
A hammer indicates that, despite initially selling pressure, the buyers have been able to regain control of the market. This is signalling the completion of a downward trend and the commencement of an upward movement. The validity of the hammer pattern can be increased by higher trading volume, which shows significant buyer interest in reversing the trend.
What is the Direction of the Hammer Pattern?
- Bullish Reversal – The hammer signals that the downtrend may be losing momentum and that an uptrend reversal may be just around the corner.
- Confirmation Signal – While the hammer pattern is a signal in and of itself, traders frequently watch for confirmation in the shape of a bullish candle to demonstrate a reversal is in fact taking place.
Dragonfly Doji

The Dragonfly Doji is very similar to a Hammer and characterised by its small body at the top of the candle bar and its long lower shadow, similar to that of a dragonfly.
What are the Indicators of a Dragonfly Doji Pattern?
- Seek out a candlestick with a small body only.
- Validate that the candlestick is red and hence opening price > closing price.
- Verify that the bottom shadow is noticeably longer than the actual body.
- Verify that the top shadow is not present at all, or just very small.
- Take into account the situation:
– The Dragonfly Doji is most significant when it shows up following a downtrend.
– A Dragonfly Doji’s validity as a potential reversal indicator is increased when its body forms close to a strong support level.
How to Interpret the Dragonfly Doji Pattern?
The pattern indicates that, after an initial period of selling pressure, the price has been successfully pushed back up, suggesting the commencement of an upward movement.
The length of the lower shadow suggests that the price reached its lowest level during the period but was able to close near the opening level, indicating that there is substantial support at this price level and that buyers are willing to restrain further price decline.
A relatively high trading volume adds more weight to the reversal signal, however traders typically wait until the following candlestick closes higher to confirm the reversal before initiating trading.
What is the Direction of the Dragonfly Doji Pattern?
Bullish Reversal
A Dragonfly Doji typically appears after a declining trend and indicates a reversal to an upward trend. It is indicative of a bullish shift in the sentiment of the market. Consequently, traders may view this as a potential opportunity to initiate long positions.
Validation
If the subsequent candle closes above the closing price of Dragonfly Doji, it adds further support for a potential reversal. This indicates that buyers are gaining momentum.
Bullish Spinning Top

A bullish spinning top, is a bullish chart pattern characterised by a small body and two equal length shadows, upper and lower shadow.
What are the indicators of a Bullish Spinning Top Pattern?
- Seek out a candlestick with a small body only.
- Validate that the candlestick is green and hence closing price > opening price.
- Verify that the bottom shadow is noticeably longer than the actual body.
- Verify that the top shadow is either very brief or not present at all.
- Take into account the situation:
– The Bullish Spinning Top is most significant when it shows up following a downtrend.
– A Bullish Spinning Top’s validity as a potential reversal indicator is increased when its body forms close to a strong support level.
How to Interpret the Bullish Spinning Top Pattern?
This suggests that, despite the initial fluctuations between the buyers and sellers in the market, the buyers eventually gained control and drove the price upwards. The recognizable appearance of this pattern makes it accessible to beginners, providing a clear visual indication of potential trend shifts.
Additionally, advanced traders appreciate the significance of this pattern, as it illustrates a state of market uncertainty, followed by an upturn, which is in line with broader technical analysis and can be complementary to their trading strategies.
What is the Direction of the Bullish Spinning Top Pattern?
Bullish Reversal
If a bullish spinning top with a green body develops after a prolonged downturn, it indicates that the sellers are losing momentum and the buyers are gaining control. This could indicate that the downtrend is decreasing and that an uptrend is about to begin.
Our next article looks at neutral candlestick patterns and how they could potentially affect your trading strategy.
Theoreticals aside, if you wish to begin trading crypto derivatives or spot on BitMEX, you can find all our existing products here. For more educational resources on trading at BitMEX, particularly derivatives, visit this page.
To be the first to know about our new listings, product launches, giveaways and more, we invite you to join one of our online communities and connect with other traders. For the absolute latest, you can also follow us on Twitter, or read our blog and site announcements.
Related
The post appeared first on Blog BitMex


