
Regardless of experience, when it comes to trading success, a key element is technical analysis and the subsequent strategies employed. By definition, technical analysis is a method that forecasts future market movements, based on historical data, while also taking into consideration current prices.
The most common of techniques within technical analysis being the analysis of chart patterns – essential for determining price signals, namely whether movements will be bullish, neutral or bearish.
Although the results of chart pattern analysis does not guarantee exact results, it serves as a good foundation for price predictions and should be in any trader’s arsenal.
An Introduction to Chart Patterns
Chart patterns form the foundation of technical analysis, given that they serve as distinctive formations generated by movements of chart prices. Before going into the details of chart patterns, it is important to have a good understanding of trendlines within technical analysis.
Trendlines
Analysing charts is based upon identifying trend lines and curves.
Through the connection of descending peaks (highs) or ascending troughs (lows), trendlines can signal changes in prices. The emergence of foresights into market shifts are a useful tool for traders to visualise roadmaps to predicting and reacting to changing price dynamics.
Setting up your chart for observations 
In order to set up a chart for pattern analysis, it’s important to define the timeframe for the analysis. Timeline is defined by selecting the right time frame for every datapoint on the chart.
The most common timelines to use are:
- Short-term: 3min or 5min
- Mid-term: 1h and 6h
- Long-term: 1 day
It is also important to have visibility of the prices and the trading volumes on the chart.
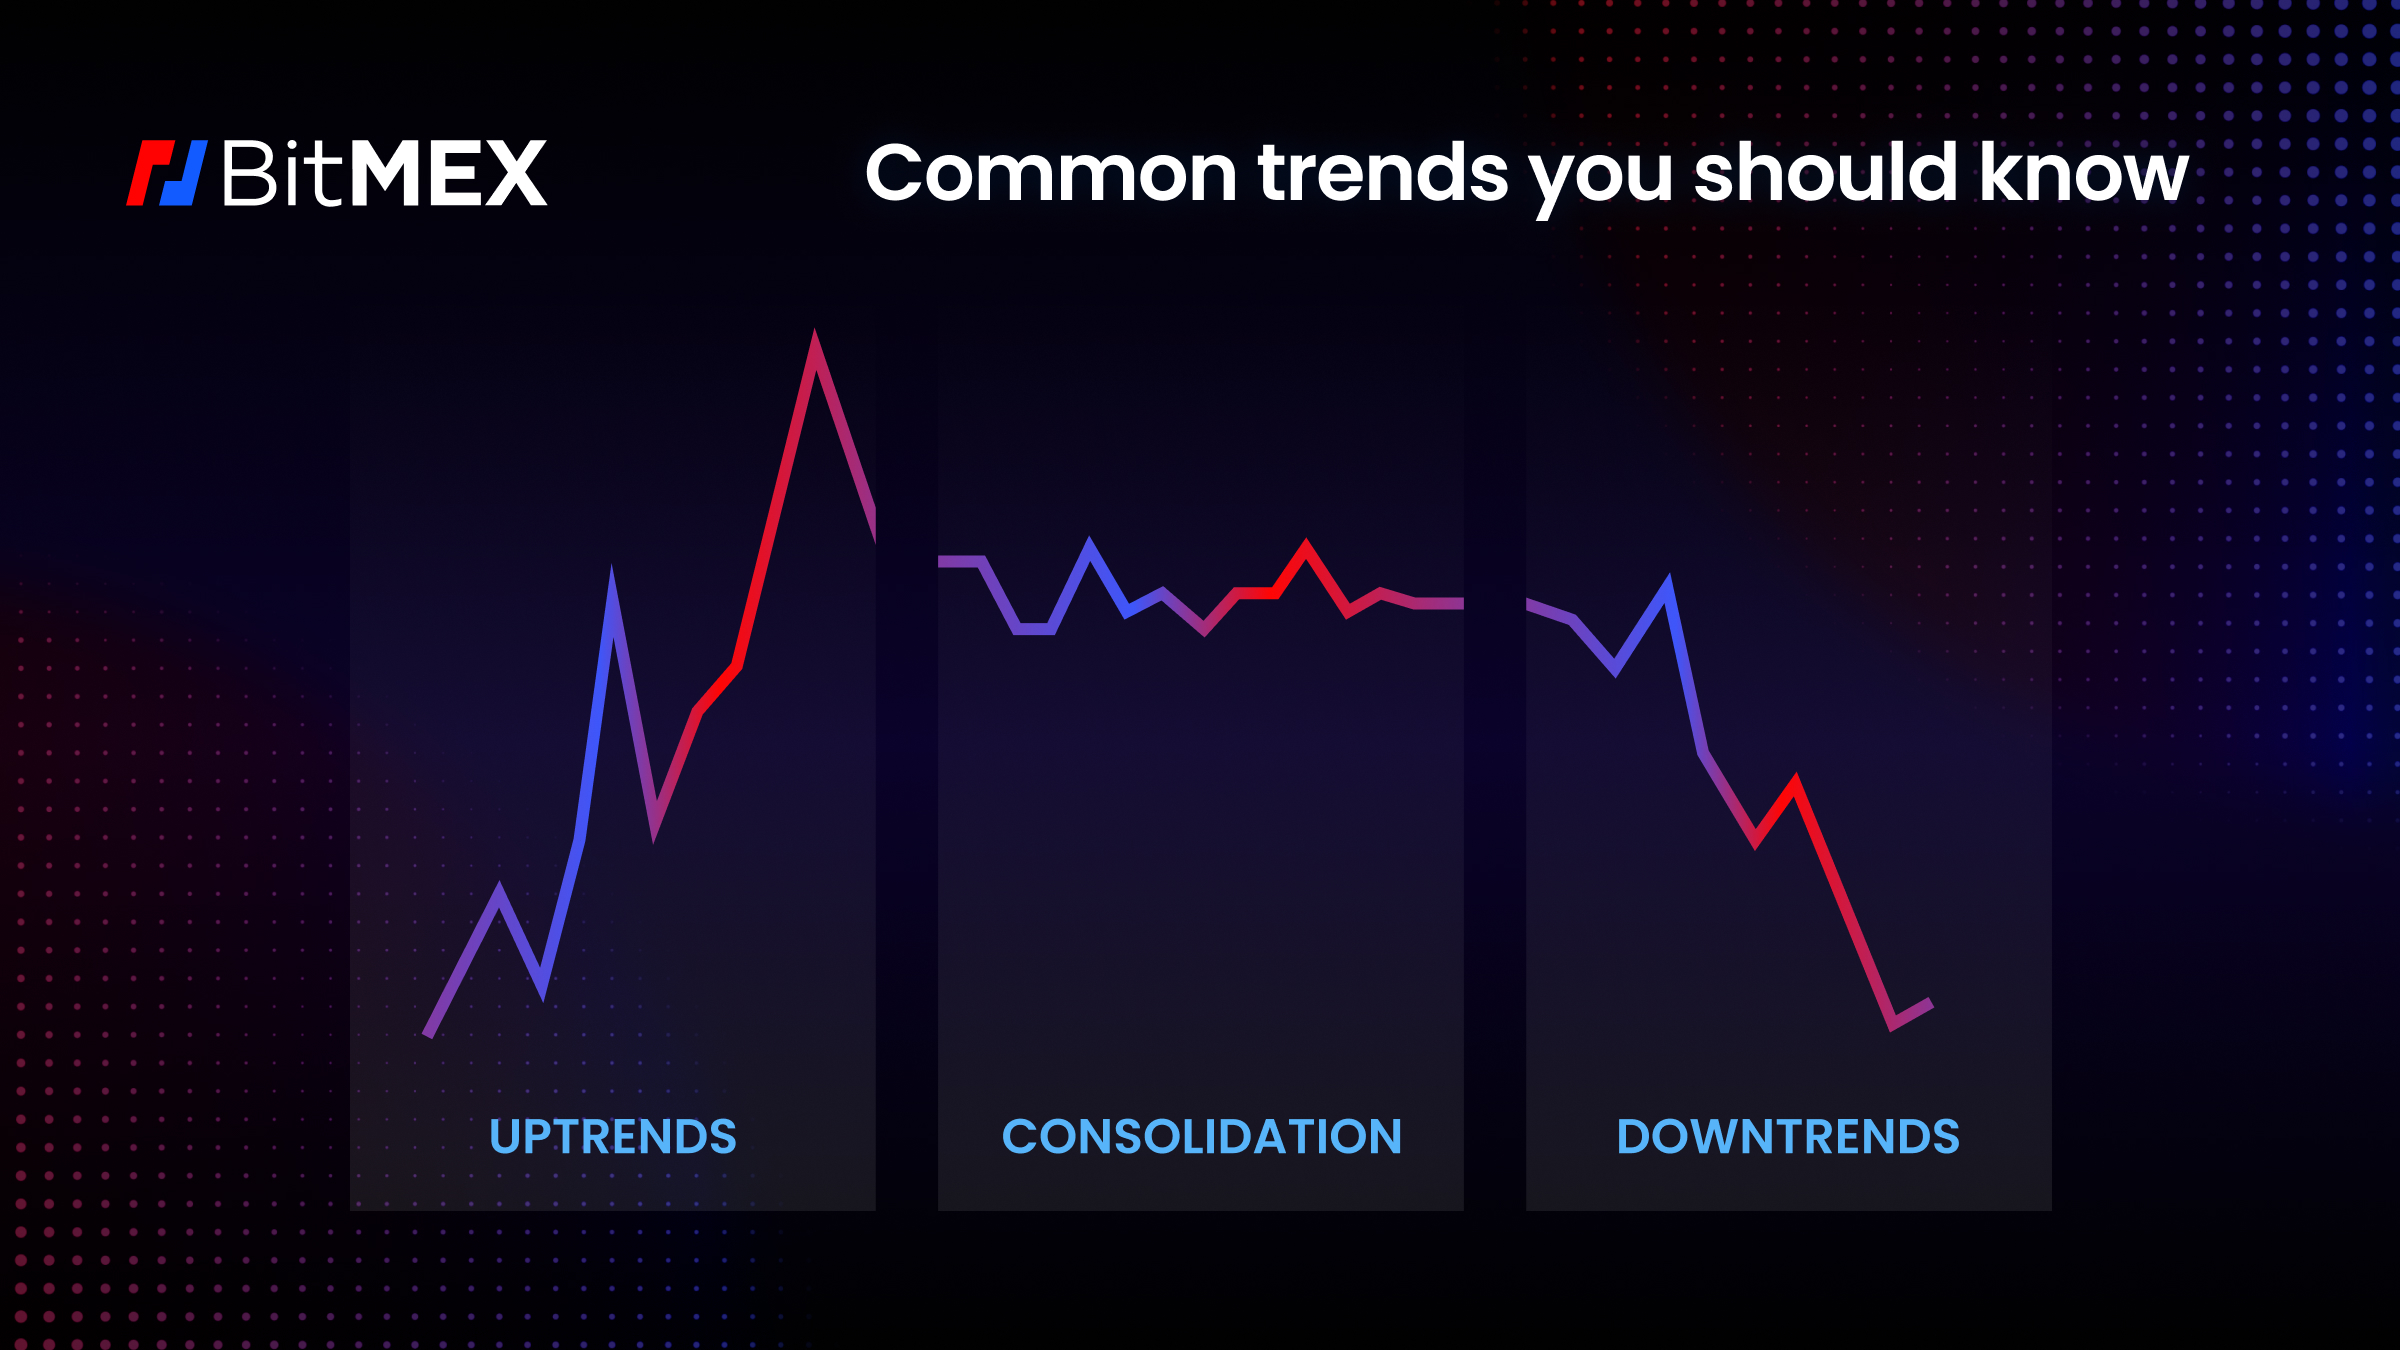
Common Trends
Price changes are dominated by three basic trends: uptrends, downtrends, and consolidations. Listed below are some of the most common trends observable in trading charts.
Uptrends
Uptrends indicate a bullish market period with prices rising as long as the trend persists. They can be identified through:
Higher Highs
When an asset is in an uptrend, its price marks new highs that are higher than previous highs. Buyers are willing to buy at higher prices indicating their optimistic outlook for the asset’s value.
Higher Lows
There can be minor pullbacks or corrections in price, but these corrections do not return the price back to its previous lows. The rising lows during the upswing may show that buyers are entering the market to support the price at higher levels.
Support Lines
An ascending or upward-sloping trendline is produced by drawing a connection of the higher lows. The upward sloping trendline is a support level to observe and predict the expected level of higher lows in the next period. The uptrend persists as long as the upward sloping trendline is not crossed by the next low.
Volume Analysis
Trading volumes are higher during uptrends, and lower during pullbacks in uptrends.
Downtrends
Downtrends indicate a bearish market period with prices falling as long as the trend persists. They can be identified through:
Lower Highs
In a downtrend, each subsequent peak in price is below the previous peak. It suggests that selling pressure is predominant and sellers are unable to raise the price to a higher level. Buyers have a pessimistic perspective on the asset’s value and are not willing to pay higher prices.
Lower Lows
The lows of the price chart correspond to the lower highs and continue to decline. Every subsequent low is below the previous one, indicating that the price is continuing to decline.
Support Lines
A descending or downward-sloping trendline is produced by drawing a connection of the lower highs. The downtrend persists as long as the downward sloping trendline is not crossed.
Resistance Levels
As the price declines, it may reach levels of support (potential buying interest) and resistance (potential selling pressure). These levels can be used by traders to identify entry or exit points.
Volume Analysis
Trading volumes during the negative price trend seeking new lows whilst volumes are lower during the upward price movements within the downward trend.
Consolidation
Price Movement
A consolidation pattern is neutral or lateral price movement, typically formed following a bullish or bearish price movement. Prices during a consolidation tend to oscillate between similar lows and highs for a period of time. The entry movement is referred to as a “preliminary trend” and builds the directional assumption for the next price movement, following the consolidation phase.
Decreasing Volatility
The price swings within the consolidation are smaller compared to the preceding trend, indicating a temporary balance between buyers and sellers.
Volume
Trading volume tends to decrease as a whole during a consolidation pattern. This decrease in volume indicates a decrease in market participants and may be indicative of the market’s lack of clear direction.
Support Lines
During a consolidation phase, trendlines can be drawn by connecting the higher highs and the lower lows. The consolidation persists as long as neither of the two trendlines is crossed.
Breakout
A breakout marks the end of the consolidation phase, when the price crosses decisively above the top (bullish) or bottom (bearish) of a consolidation range. A breakout is often triggered by new information received by the market participants, helping to form a new buy or sell direction. If the consolidation was only short term, the breakout usually confirms the previous trend.
Confirmation
False breakouts can occur when the price briefly crosses the threshold and then reverses. Traders should therefore seek confirmation of a breakout through observing an increase in trading volume and a consistent price movement in the direction of the breakout.
Part two of this series will further cover chart patterns, its types and how to identify them.
Theoreticals aside, if you wish to begin trading crypto derivatives or spot on BitMEX, you can find all our existing products here. For more educational resources on trading at BitMEX, particularly derivatives, visit this page.
To be the first to know about our new listings, product launches, giveaways and more, we invite you to join one of our online communities and connect with other traders. For the absolute latest, you can also follow us on Twitter, or read our blog and site announcements.
Related
The post appeared first on Blog BitMex


