
The tight range continues to play: Over the past two days, since our recent price analysis, we saw Bitcoin keeping up the $10,000 support alive.
More than that, Bitcoin didn’t break down the mentioned triangle formation. During the recent hours, we saw Bitcoin spiking up to a 5-day high – $10,805 on Bitmex (while on Bitstamp the highest price was $10,650). ‘Spiking up’ – since the price didn’t hold, and quickly went down, in something that reminds another Bitcoin price manipulation.
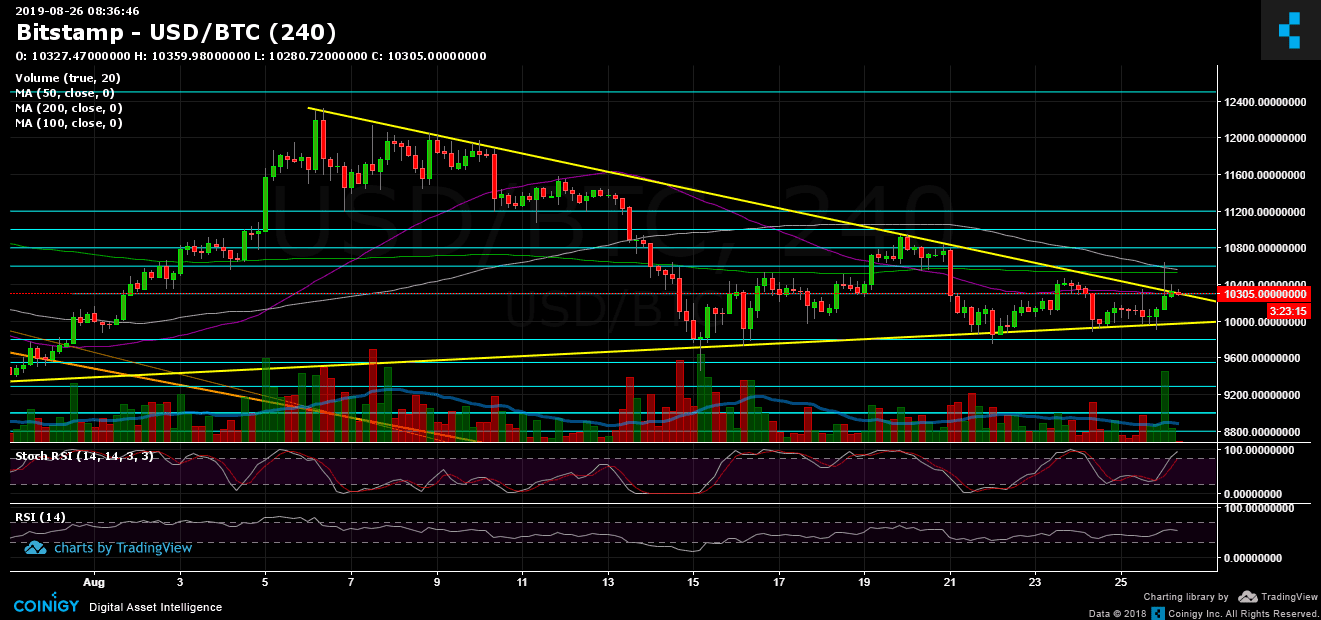
Keeping the above in mind, and looking on the 4-hour chart, we can see that excluding the candle’s wick, the spike reached the upper boundary of the triangle.
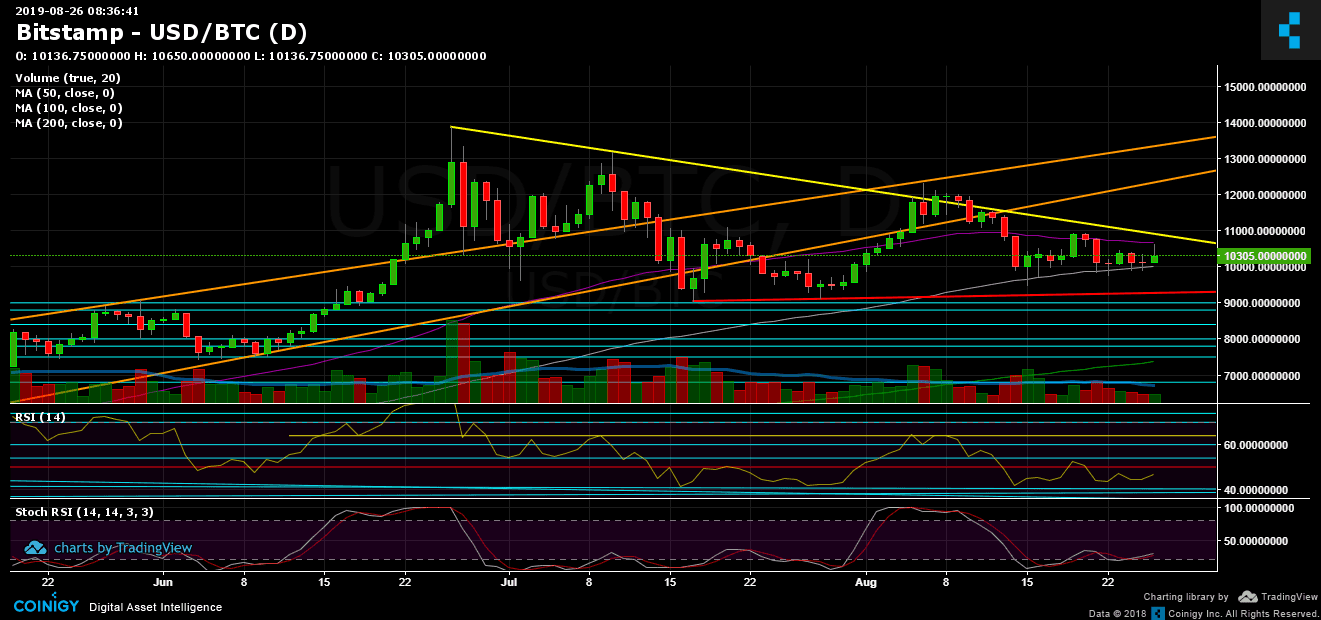
Looking on the daily chart, the spike reached exactly the significant 50-days moving average line (marked purple). So overall, the price is still inside the boundaries: on the daily – between the 50 and the 100 days moving average lines, and on the 4-hour chart inside the triangle formation.
It seems like a breakout is indeed coming up. But will the bulls gain enough momentum? Or will it be the bears, who will retake the price to the lower boundary of the triangle, for maybe the tenth time trying to break down the $10,000 support area?
Total Market Cap: $268 billion
Bitcoin Market Cap: $185 billion
BTC Dominance Index: 68.8%
*Data by CoinGecko
Key Levels to Watch
– Support/Resistance:
Following the recent price spike, Bitcoin is now facing resistance around the $10,300 area, along with the triangle’s descending trend-line. Breaking it up is likely to send Bitcoin to the next resistance around the mentioned 50-days moving average line ($10,700 – $10,800), before reaching again to the unbreakable $11,000 region.
From below, Bitcoin sees the good-old $10,000 area (along with MA-100) which had proved so far to be the Chinese Wall. So durable, but a breakout is likely to produce a huge price move to the downside. Possible support levels can be $9600 (weak), $9400, and then the $9000 – $9200 range. Further below are $8800 and $8500.
– Daily chart’s RSI: The indicator also tells the recent price action of Bitcoin. The RSI is hovering under tight range, in an indecisive behavior. No new lower lows, while no new higher highs. It’s currently facing the 47 resistance, before the significant 50 levels.
– Trading Volume: As mentioned on the previous price analysis, we expected the vast price move, following four consecutive days of decreasing volume. It will be interesting to see how today’s volume candle will end up, to see if the bulls are indeed back in the game.
BTC/USD BitStamp 4-Hour Chart
BTC/USD BitStamp 1-Day Chart
More news for you:


The post appeared first on CryptoPotato


