
Bitcoin’s exciting bull run might be over as quickly as it started after prices failed to close above the $12,400 daily resistance yesterday. Any hopes of a parabolic continuation will now have to be put on hold as bulls recover from the sharp decline.
In the last 24 hours, the global crypto market capital has lost $13 billion from its peak at $387 billion.
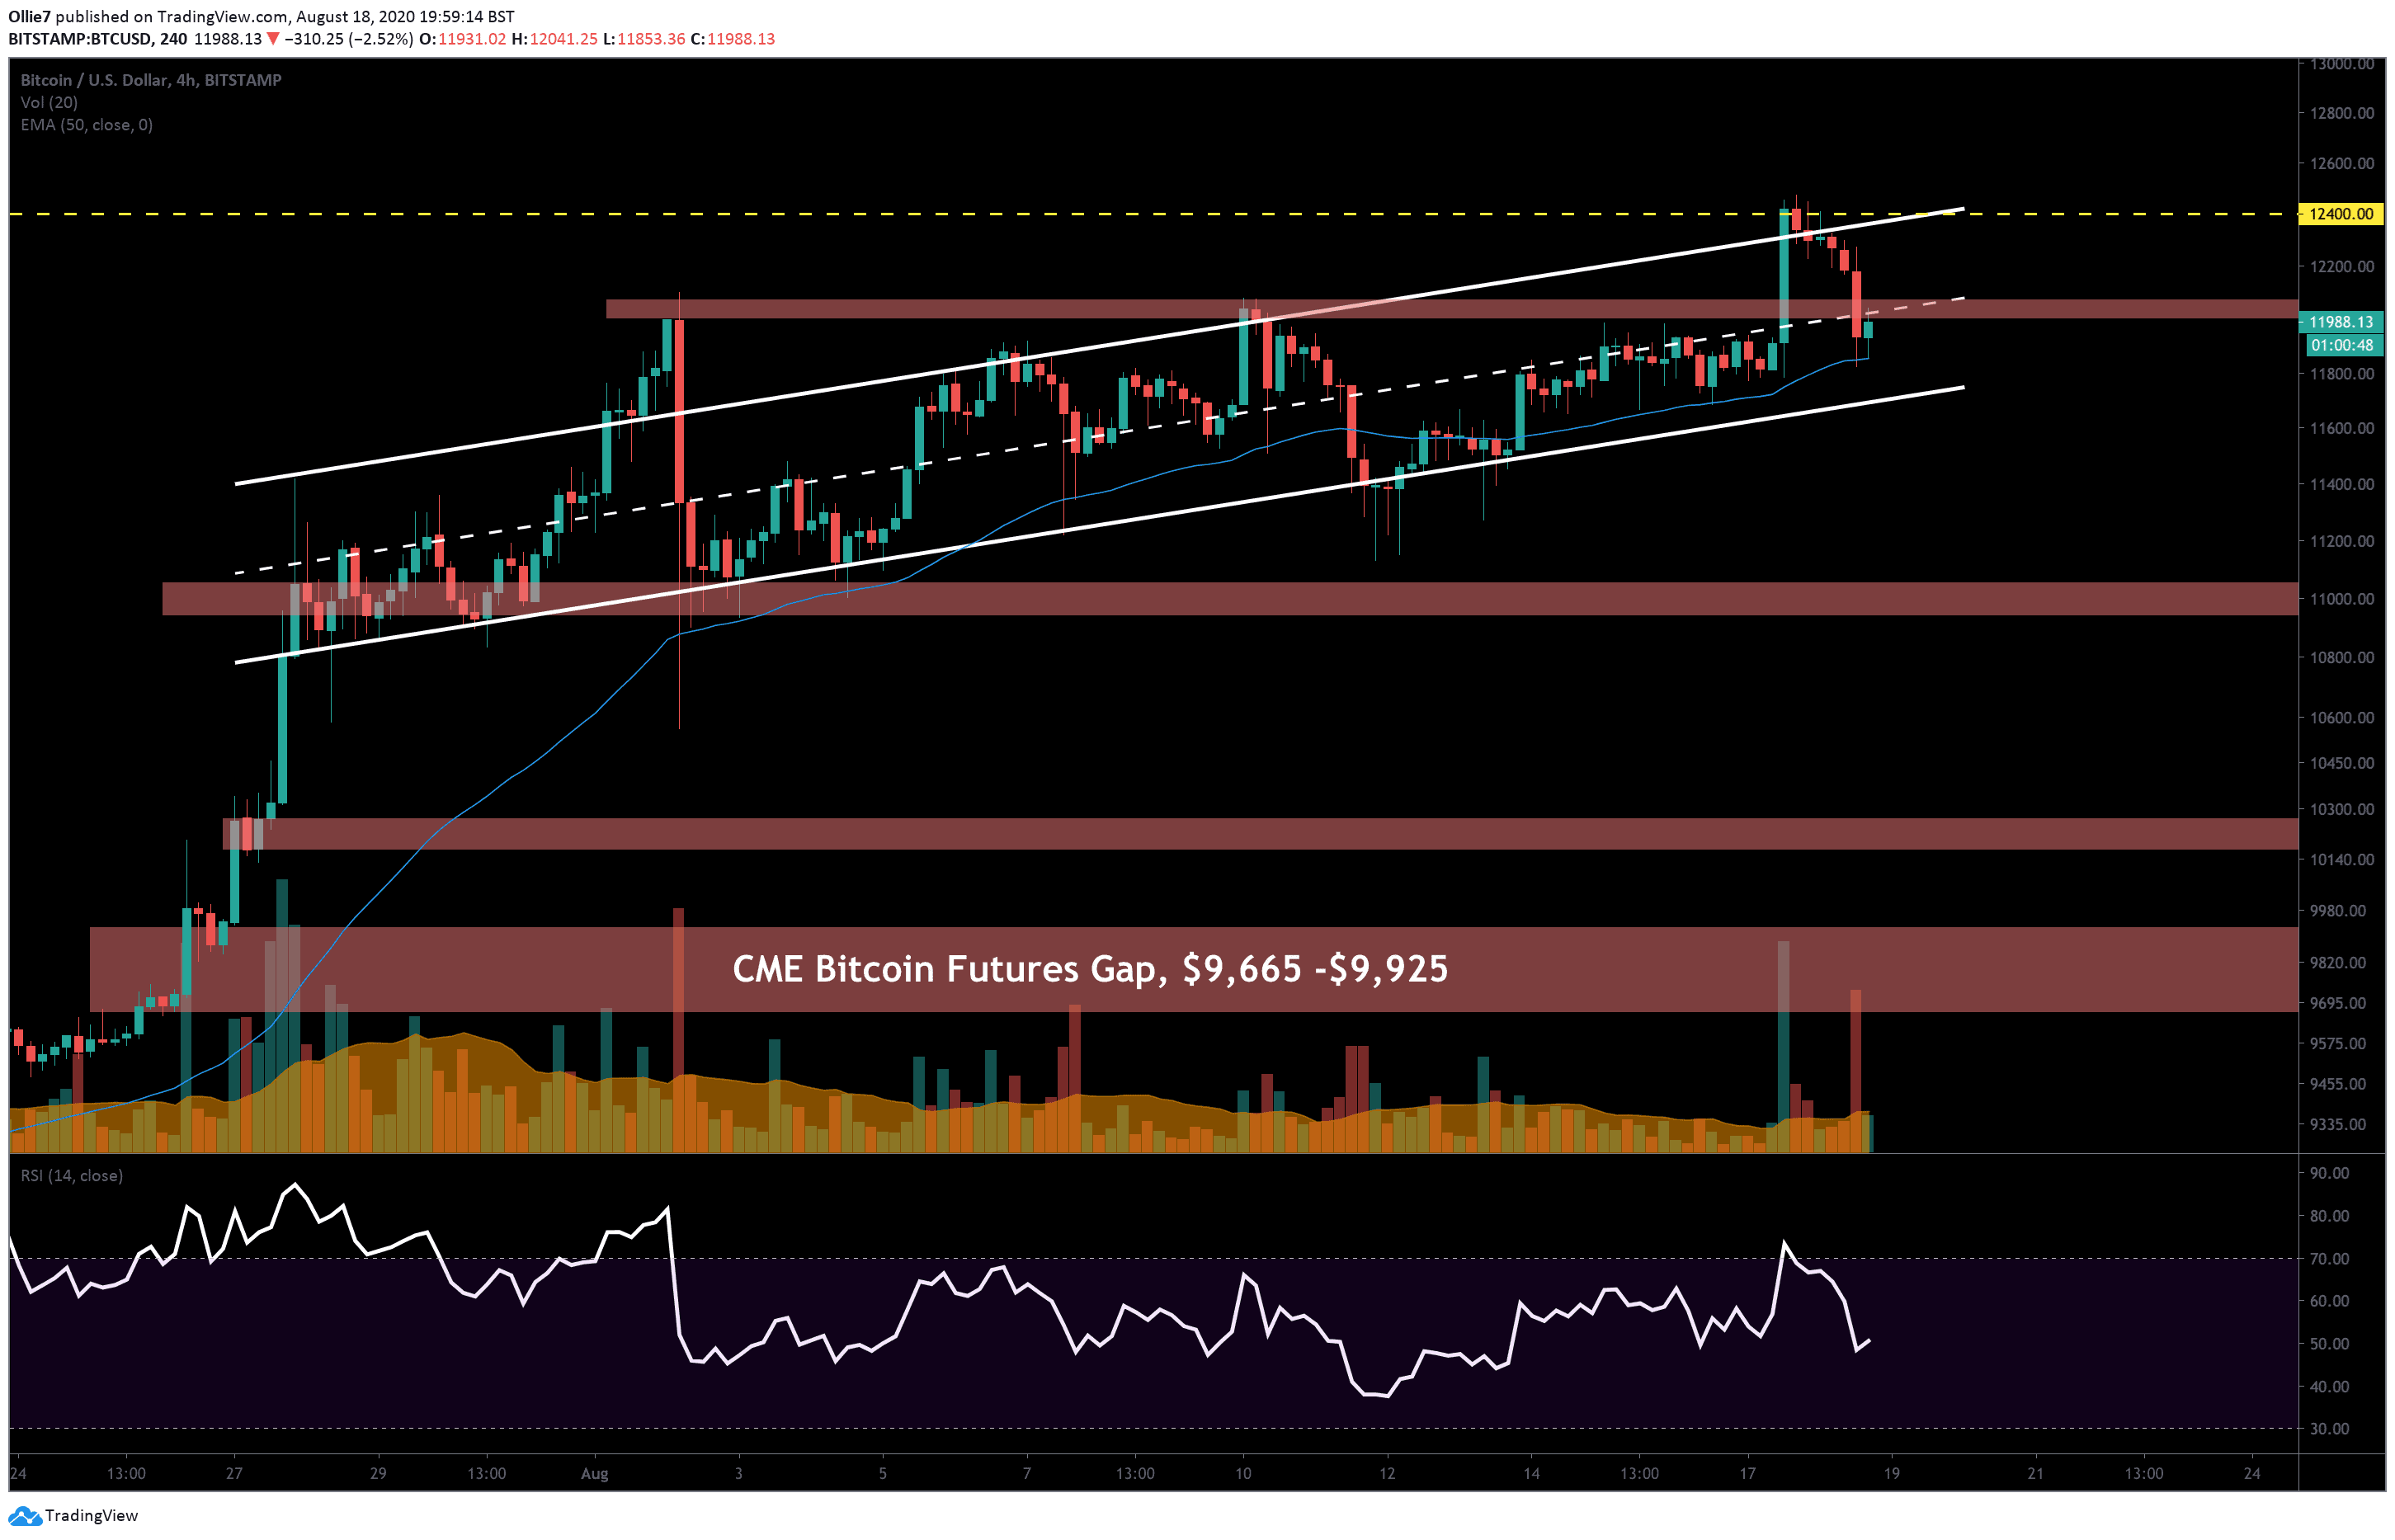
It’s still unclear what caused the sudden reversal. However, shortly after BTC prices catapulted to $12,400, the leading crypto broke into the overbought region on the 4-Hour RSI. This would have likely triggered a number of trading bots to sell and could’ve helped initiate the downtrend.
Price Levels to Watch in the Short-term
Looking at the 4-hour chart, we can see that the price action has returned underneath the median line (dashed white line) of the parallel channel. This level now also overlaps with the main resistance area (green) around the psychological $12,000 mark.
In the short-term, this particular cross-section will be a key resistance for BTC to break. If we see a candle close above this, then it’s more than likely bulls will drive straight towards the overheard channel resistance again, at approximately $12,370.
Key targets for the breakout continue to be the $12,400 and $12,800 levels above.
Bitcoin’s main support right now appears to be the 50 EMA line (blue), which has propped up the current price action twice now during the intraday session. A close beneath this level would likely see prices dive under the channel support, and into the liquidity zone beneath.
Looking back at all the times in the last month when BTC has broken beneath the channel, we can see that prices have always retraced back to the median line shortly after, as whales buy back into the selling pressure.
This stop hunting technique is done primarily to shake out weak hands right before a bullish reversal takes place. Keep an eye out for it if the price action drifts back to the main support again.
Total market capital: $385 billion
Bitcoin market capital: $221 billion
Bitcoin dominance: 57.5%
BTC/USD Bitstamp 4-Hour Chart
Click here to start trading on BitMEX and receive 10% discount on fees for 6 months.
Disclaimer: Information found on CryptoPotato is those of writers quoted. It does not represent the opinions of CryptoPotato on whether to buy, sell, or hold any investments. You are advised to conduct your own research before making any investment decisions. Use provided information at your own risk. See Disclaimer for more information.
The post appeared first on CryptoPotato


