
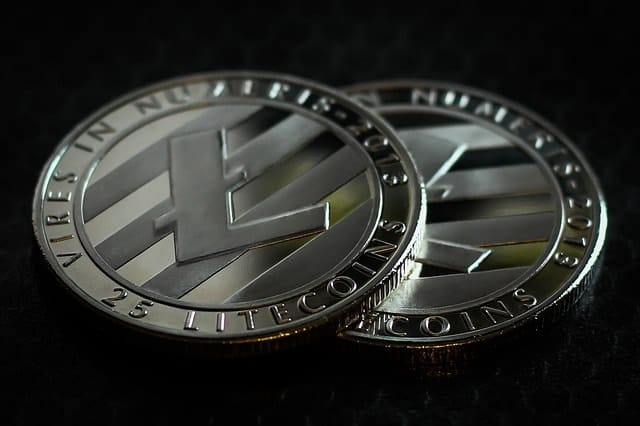
Binance Coin has seen a decrease of around 3.76% over the past 24 hours which brought its price to $21.59. BNB has been struggling as of late after dropping by 14% over the past week and with 22% over the past month.
Binance is the seventh-largest cryptocurrency with a market cap of $3.39 billion but EOS is quickly creeping up, sitting only $300M behind it.
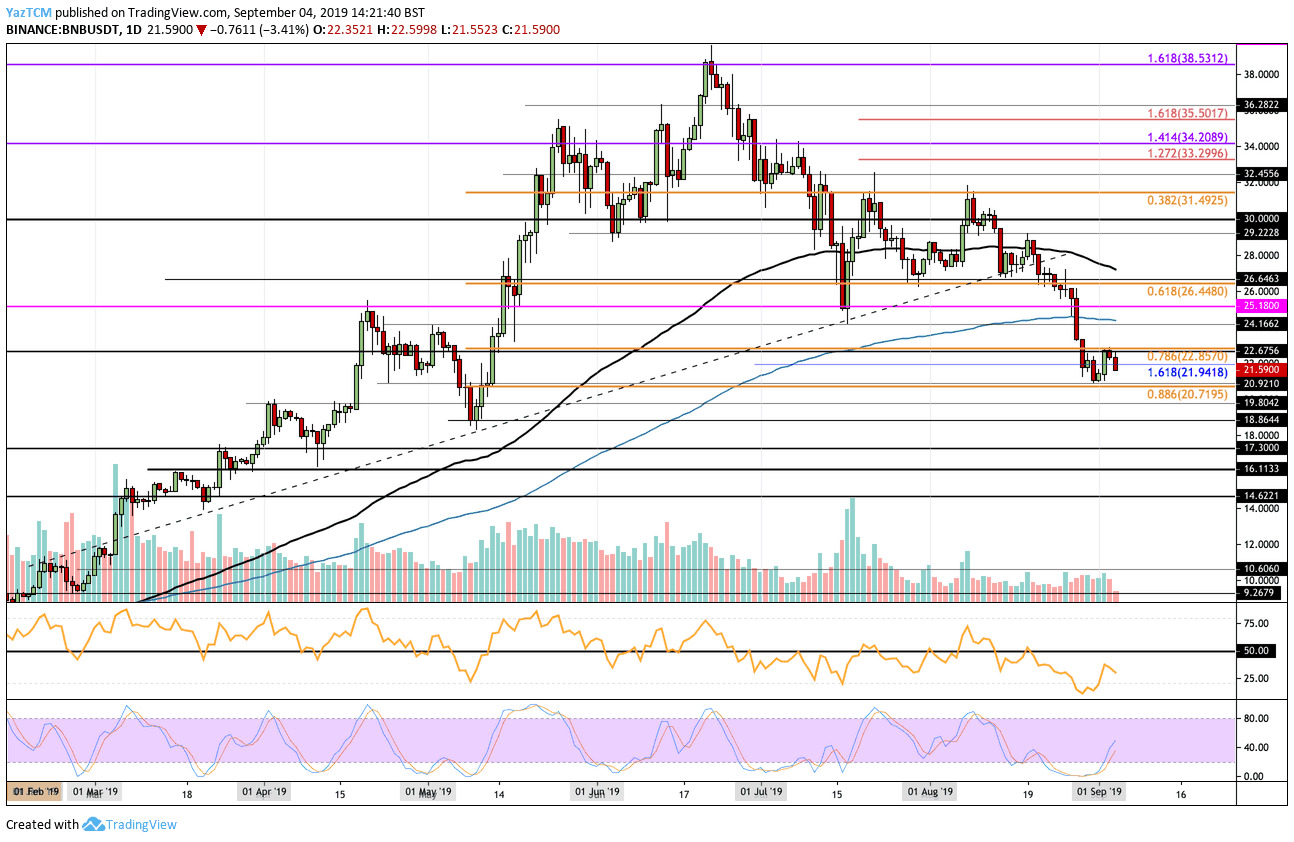
- Since our previous BNB analysis, BNB fell below the support at $21.94 but had managed to find further support at $20.71 provided by the .886 Fibonacci Retracement level. After reaching this level, BNB rebounded higher but had met resistance at $22.85 (previous .786 Fib Retracement).
- From above: The nearest level of resistance lies at $22.85. Above this, resistance is found at $25 (200-days EMA), and $25.18 (previous strong resistance/support). Further resistance lies at $26.44, $27 (100-days EMA), $28, and $30.
- From below: The nearest level of support lies at $20.71. If BNB falls beneath $20, support can be found at $19.80, $18.86, $18.16, $18.00, and $17.30.
- The trading volume remains at a low level that has been the average for August.
- The RSI is well beneath the 50 level as the bears remain in control over the market momentum. However, the Stochastic RSI has produced a bullish crossover signal in extreme oversold territory which could result in the bulls regaining momentum.
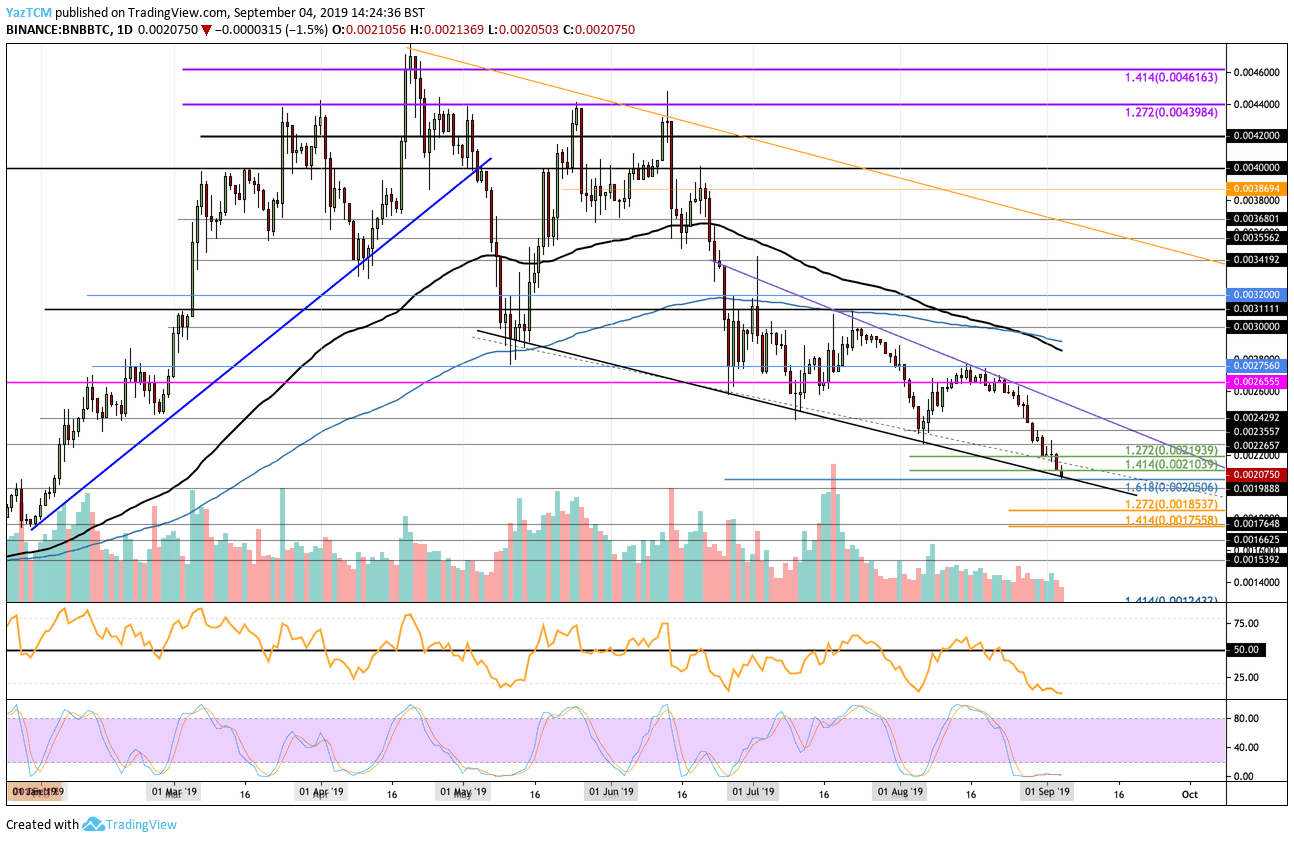
- Against Bitcoin, BNB has fallen beneath the support at 0.003 BTC and continued to go lower until finding support at 0.00205 BTC provided by a medium termed downside 1.618 Fib Extension (marked in blue). BNB has now dropped into the lower boundary of a steep descending wedge which should provide strong support moving forward.
- From above: The nearest level of resistance lies at 0.0021 BTC and 0.0022 BTC. Above this, resistance is located at 0.002265 BTC, 0.002355 BTC, and 0.002492 BTC.
- From below: The nearest level of support lies at 0.0020 BTC and the lower boundary of the wedge. If the sellers break beneath the wedge, support is located at 0.001988 BTC, 0.0019 BTC, 0.001963 BTC(downside 1.272 Fib Extension), and 0.001755 BTC (downside 1.414 Fib Extension).
- The trading volume has remained at a low level and is starting to drop off further.
- The RSI is well within the favor of the bears as it sits in extreme oversold conditions. For a sign of recovery, we will look for the RSI to start to rise which will show the sellers’ momentum is starting to fade. Furthermore, the Stochastic RSI is also in extreme oversold territory as we wait for a bullish crossover to signal a move higher.
Be the first to know about our price analysis, crypto news and trading tips: Follow us on Telegram or subscribe to our weekly newsletter.
More news for you:

By George Georgiev / Sep 4, 2019

By George Georgiev / Sep 4, 2019
By George Georgiev / Sep 3, 2019

By Yoni Berger / Sep 3, 2019

By Yordan Lyanchev / Sep 3, 2019
By George Georgiev / Sep 3, 2019

By Yuval Gov / Sep 2, 2019
By George Georgiev / Sep 2, 2019

By Yaz Sheikh / Sep 2, 2019

By George Georgiev / Sep 2, 2019
By George Georgiev / Sep 1, 2019

By Yuval Gov / Sep 1, 2019

By Yaz Sheikh / Aug 31, 2019

By Yordan Lyanchev / Aug 31, 2019
By Yaz Sheikh / Aug 30, 2019
By George Georgiev / Aug 30, 2019

By George Georgiev / Aug 30, 2019
By Yaz Sheikh / Aug 29, 2019

By George Georgiev / Aug 29, 2019

By George Georgiev / Aug 29, 2019
The post appeared first on CryptoPotato


