
Bitcoin price is down around 4% and it broke the key $7,000 support against the US Dollar.The price is likely to continue lower towards $6,500 or $6,200 in the near term.There is a short term contracting triangle forming with resistance near $6,880 on the hourly chart of the BTC/USD pair (data feed from Kraken).The pair could gather momentum once it breaks the $6,800 support area.Bitcoin (BTC) price is showing signs of bearish continuation below $6,800 against the US Dollar. BTC bears seems to be eyeing a test of the $6,500 support or $6,200.Bitcoin Price AnalysisAfter consolidating above the $7,000 support, bitcoin bears gained strength against the US Dollar. As a result, BTC price nosedived below the $7,000 support and settled well below the 100 hourly simple moving average.The price is down around 4% and it even broke the $6,880 support area. A new monthly low is formed near $6,800 and the price is currently consolidating losses.An immediate resistance is near the $6,880 level. Besides, the 23.6% Fib retracement level of the recent downward move from the $7,135 high to $6,800 low is also near the $6,880 area.More importantly, there is a short term contracting triangle forming with resistance near $6,880 on the hourly chart of the BTC/USD pair. Therefore, an upside break above $6,880 level might start a short term upside correction.The next resistance is near the $6,980 level. Additionally, the 50% Fib retracement level of the recent downward move from the $7,135 high to $6,800 low is also near the $6,980 level.However, the main resistance is seen near the $7,000 and $7,015 levels (the recent breakdown zone). A successful daily close above $7,015 is needed to start a substantial recovery in the near term.Conversely, the price is likely to accelerate lower below the $6,840 and $6,820 levels. If bitcoin breaks the $6,800 low, the next stop for the bears could be near $6,600 or $6,500.Any further losses may perhaps lead the price towards the key $6,200 support area, where the bulls are likely to take a stand.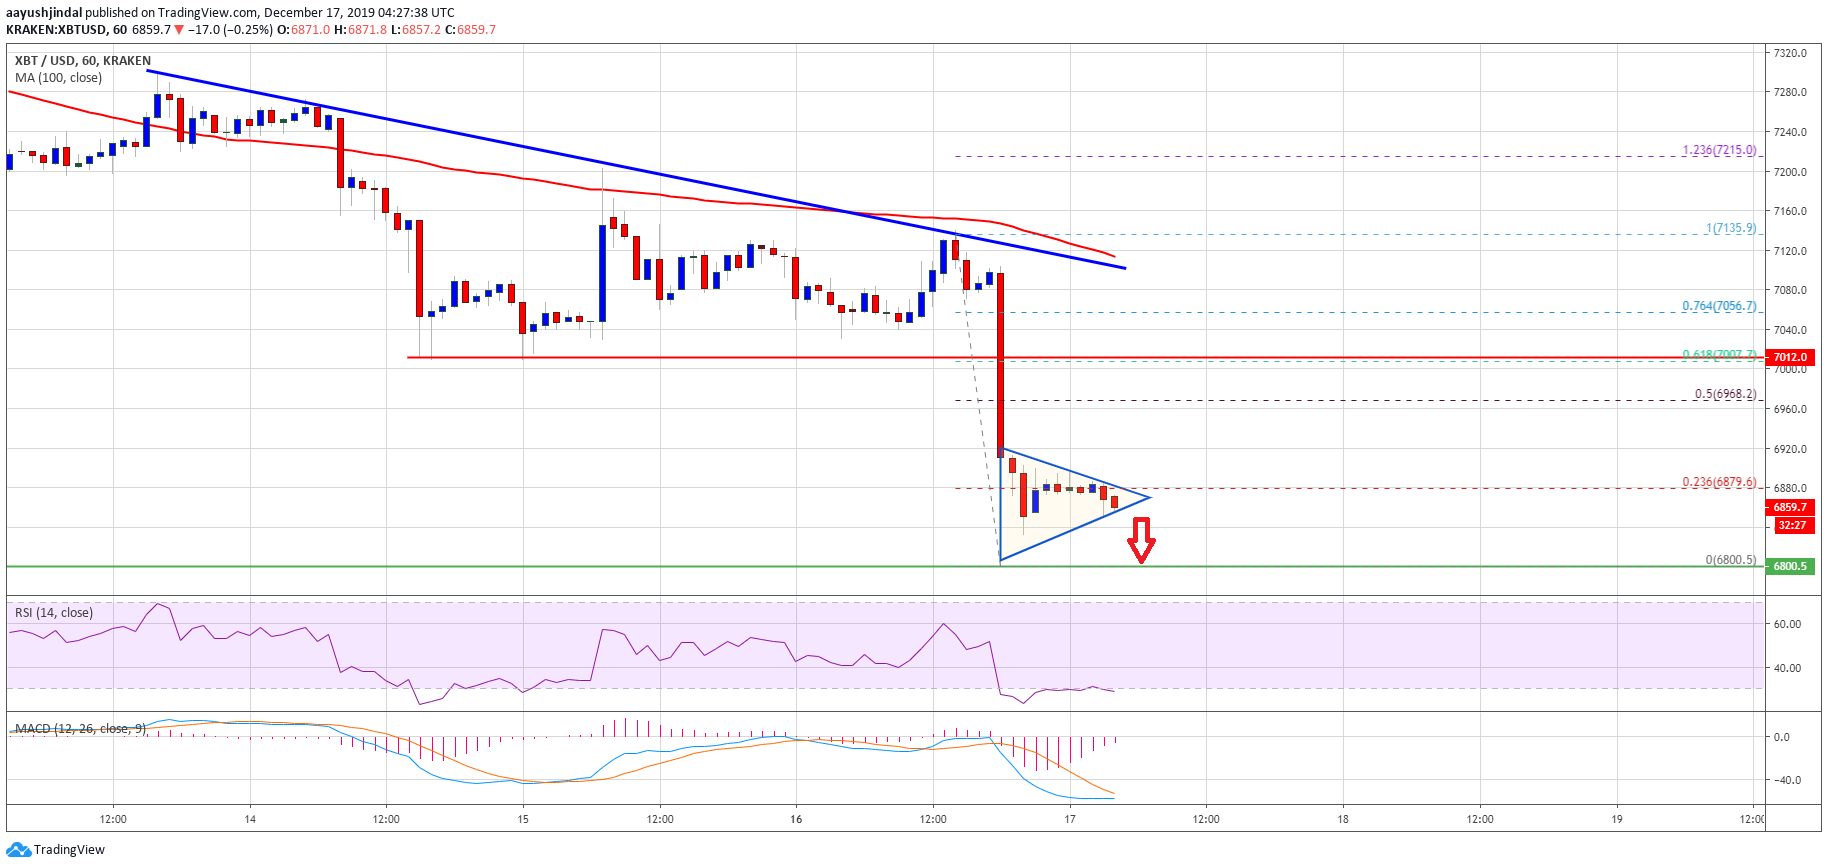 Bitcoin PriceLooking at the chart, bitcoin price is sliding heavily below $7,000 and $6,880. Thus, there are high chances of more downsides as long as the price is trading below the $7,000 and $7,015 resistance levels in the near term.Technical indicators:Hourly MACD – The MACD is currently showing signs of an upside correction.Hourly RSI (Relative Strength Index) – The RSI for BTC/USD is slowly recovering and it is near the 30 level.Major Support Levels – $6,800 followed by $6,500.Major Resistance Levels – $6,880, $7,000 and $7,015.The post appeared first on NewsBTC


