
Bitcoin price rebounded recently and climbed above the $10,200 resistance against the US Dollar.The price is currently trading nicely above $10,300, but facing hurdles near $10,500 and $10,600.There is a connecting bullish trend line forming with support near $10,250 on the hourly chart of the BTC/USD pair (data feed from Kraken).The price is likely to climb higher if it breaks the $10,600 resistance area in the near term.Bitcoin price is correcting higher with a positive bias above $10,200 against the US Dollar. BTC could continue to rise if it breaks the $10,500 and $10,600 resistances.Bitcoin Price AnalysisThis past week, we saw a sharp decline in BTC below the $10,000 support against the US Dollar. The price traded towards the $9,500 support and recently started an upside correction. It traded above the $10,000 resistance level to move into a short term positive zone. Moreover, there was a break above the $10,200 resistance and the 100 hourly simple moving average.However, the price is facing a few important hurdles near the $10,500 and $10,600 resistance levels. Already, there were a few attempts to surpass the $10,500 and $10,600 resistances, but the bulls failed. The last swing high was formed near $10,513 and the price is currently declining. It traded below the $10,400 level plus 23.6% Fib retracement level of the recent leg from the $9,998 low to $10,513 high.On the downside, there is a decent support forming near the $10,250 and $10,200 levels. Additionally, there is a connecting bullish trend line forming with support near $10,250 on the hourly chart of the BTC/USD pair. Bitcoin price might also find strong bids near the $10,225 level and the 100 hourly SMA. If the bulls fail to defend the $10,200 support, the price could decline back to $10,000.On the upside, the price is clearly facing a strong resistance near the $10,500 and $10,600 levels. Therefore, a convincing break above the $10,600 level is needed for the bulls to gain traction. In the mentioned case, the price could accelerate higher towards the $10,800 and $11,000 resistance levels.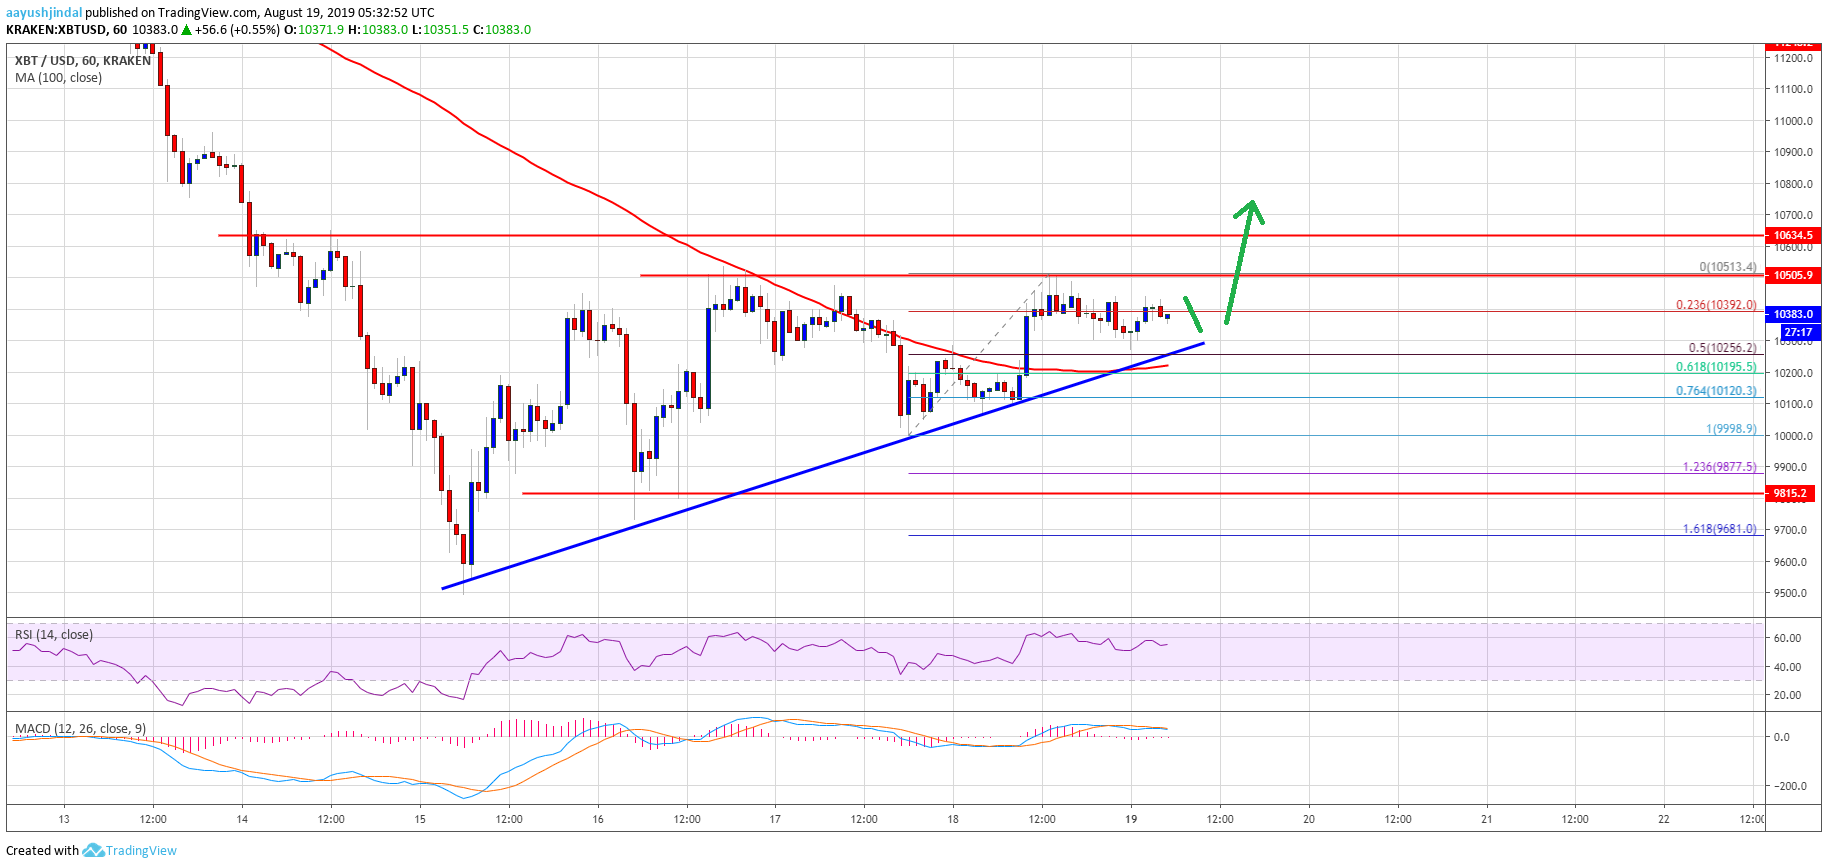 Looking at the chart, bitcoin price is approaching a crucial breakout point and it could either climb above $10,600 or start a fresh decline below $10,200. As long as there is no close above $10,500 and $10,600, the price remains at a risk of more losses. The main supports below $10,200 are near $10,000 and $9,800.Technical indicators:Hourly MACD – The MACD is likely to move back into the bullish zone.Hourly RSI (Relative Strength Index) – The RSI for BTC/USD is currently above the 50 level.Major Support Levels – $10,200 followed by $10,200.Major Resistance Levels – $10,500, $10,600 and $10,650.The post appeared first on NewsBTC


 Options Markets: Kaiko")