
Bitcoin price tested the $9,800 support and bounced back against the US Dollar.The price is currently struggling to gain momentum above $10,400 and $10,500.There is a key contracting triangle forming with resistance near $10,550 on the hourly chart of the BTC/USD pair (data feed from Kraken).The price is likely to slowly rise as long as it is trading above the $9,800 support area.Bitcoin price is showing positive signs above the $9,800 support against the US Dollar. BTC price might gain bullish momentum once it settles above the $9,500 resistance.Bitcoin Price AnalysisIn yesterday’s analysis, we discussed the chances of another pullback in bitcoin price below the $10,000 level against the US Dollar. The BTC/USD pair did move below the $10,000 support and remained well below the 100 hourly simple moving average. Moreover, there was a break below the $9,960 support area, but the $9,800 level acted as a strong support. A swing low was formed near $9,721 and the price started a fresh increase.There was a recovery above the $10,000 and $10,200 resistance levels. Moreover, the price broke the $10,400 resistance level. However, the price struggled to gain bullish momentum above the $10,500 level. More importantly, the price struggled to surpass the 100 hourly simple moving average, which is currently at $10,450. Besides, there is a key contracting triangle forming with resistance near $10,550 on the hourly chart of the BTC/USD pair.An immediate support on the downside is near the $10,130 level. It represents the 50% Fib retracement level of the recent wave from the $9,721 low to $10,542 high. However, the main supports are near the $10,000 and $9,950 levels. Additionally, the 61.8% Fib retracement level of the recent wave from the $9,721 low to $10,542 high will most likely act as a support near $10,035.On the upside, the price must gain momentum above the $10,400 and $10,500 resistance levels. Moreover, a successful close above the 100 hourly SMA could start a strong rise towards the $10,600 and $10,800 levels. Conversely, if the price starts a fresh decline and breaks the $10,000 support, the next key support is near the $9,800 level.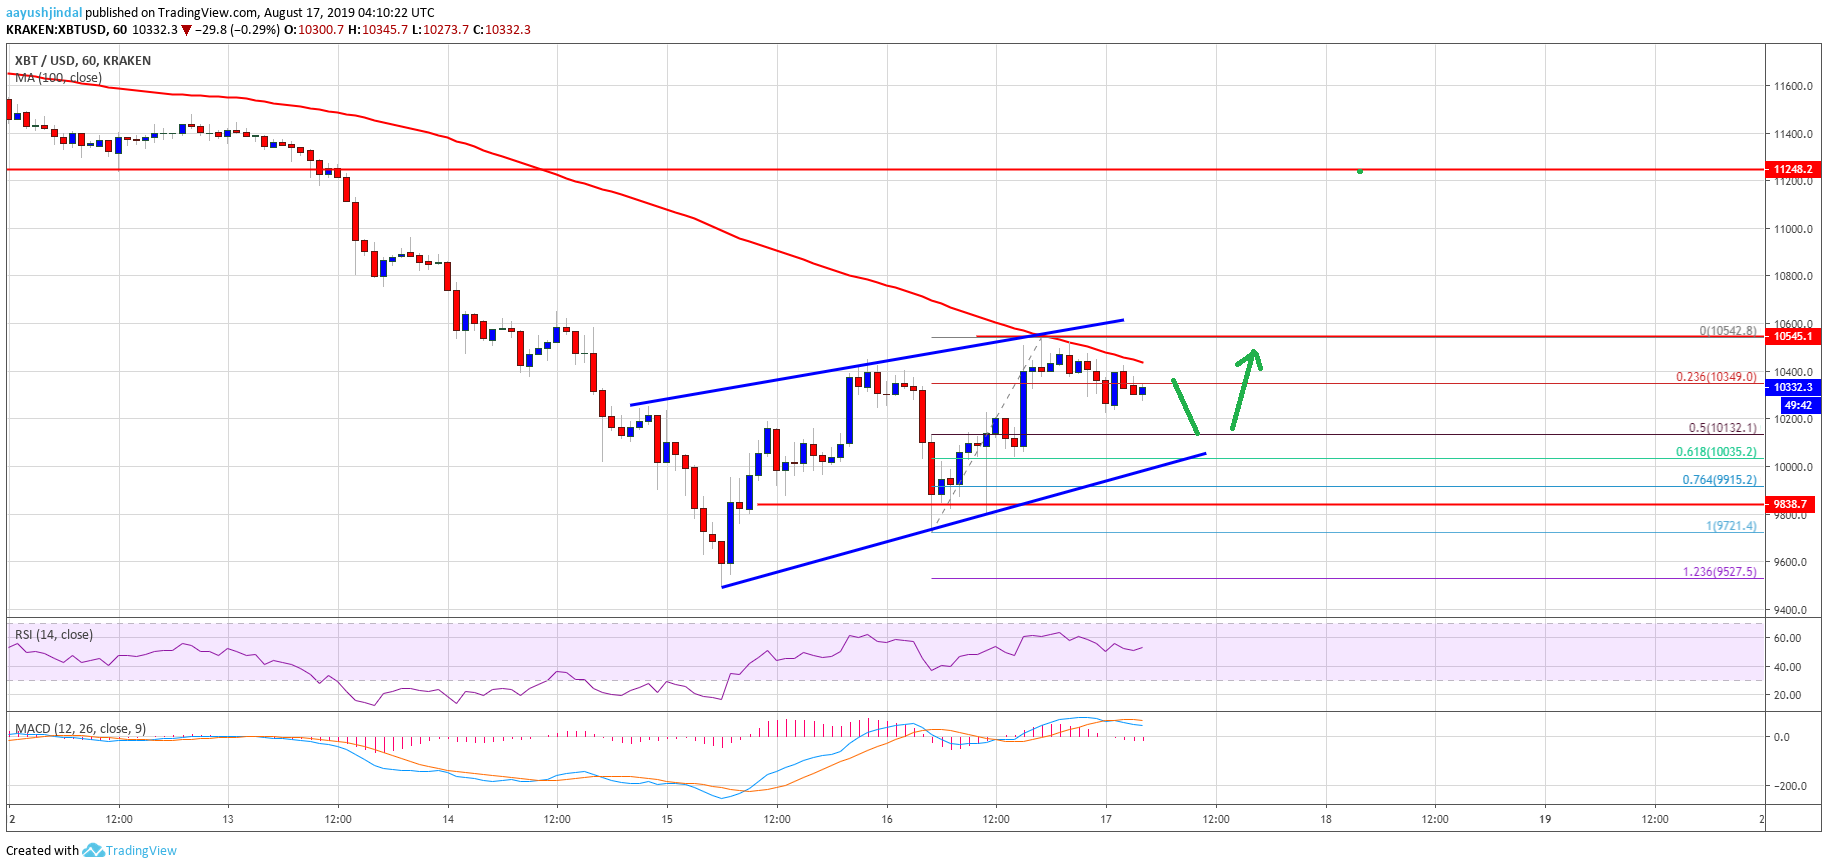 Looking at the chart, bitcoin price is clearly showing a few positive signs above the $10,000 level. Having said that, the bulls need to gain momentum above the 100 hourly SMA and $10,450 to push the price further higher in the near term.Technical indicators:Hourly MACD – The MACD is currently moving in the bearish zone.Hourly RSI (Relative Strength Index) – The RSI for BTC/USD is currently above the 50 level.Major Support Levels – $10,030 followed by $9,800.Major Resistance Levels – $10,400, $10,500 and $10,650.The post appeared first on NewsBTC


