
Bitcoin price is currently correcting higher above the $10,000 resistance against the US Dollar.The price is facing many key resistances near the $10,250, $10,300 and $10,400 levels.There is also a connecting bearish trend line forming with resistance near $10,450 on the hourly chart of the BTC/USD pair (data feed from Kraken).The price is likely to face a strong selling interest near the $10,300 and $10,400 levels.Bitcoin price is slowly correcting towards $10,300 against the US Dollar. However, BTC will most likely fail to continue above $10,300 or 10,400 in the near term.Bitcoin Price AnalysisRecently, there was a sharp decline in BTC below the $10,000 support against the US Dollar. The price even traded below $9,800 and settled well below the 100 hourly simple moving average. Finally, the previous support area near $9,750 acted as a support and prevented additional weakness. As a result, there was an upside correction initiated above the $10,000 resistance area.Moreover, there was a break above the 23.6% Fib retracement level of the main drop from the $10,976 high to $9,757 low. The price is now trading near the $10,200 resistance level. On the upside, there are many resistances near $10,250 and $10,300 levels. Additionally, there is a connecting bearish trend line forming with resistance near $10,450 on the hourly chart of the BTC/USD pair.The 50% Fib retracement level of the main drop from the $10,976 high to $9,757 low is also waiting near the $10,370 level. Finally, the 100 hourly SMA is close to $10,380 to act as a hurdle for the bulls. Therefore, an upside correction towards the $10,250, $10,300 and $10,350 levels could face a strong selling interest in the near term. If there is no upside break, bitcoin is likely to resume its decline below the $10,000 support.An immediate support is near the $9,920 level, below which the price is likely to revisit the $9,750 support area. Any further decline may perhaps push the price towards the $9,500 support level in the coming sessions.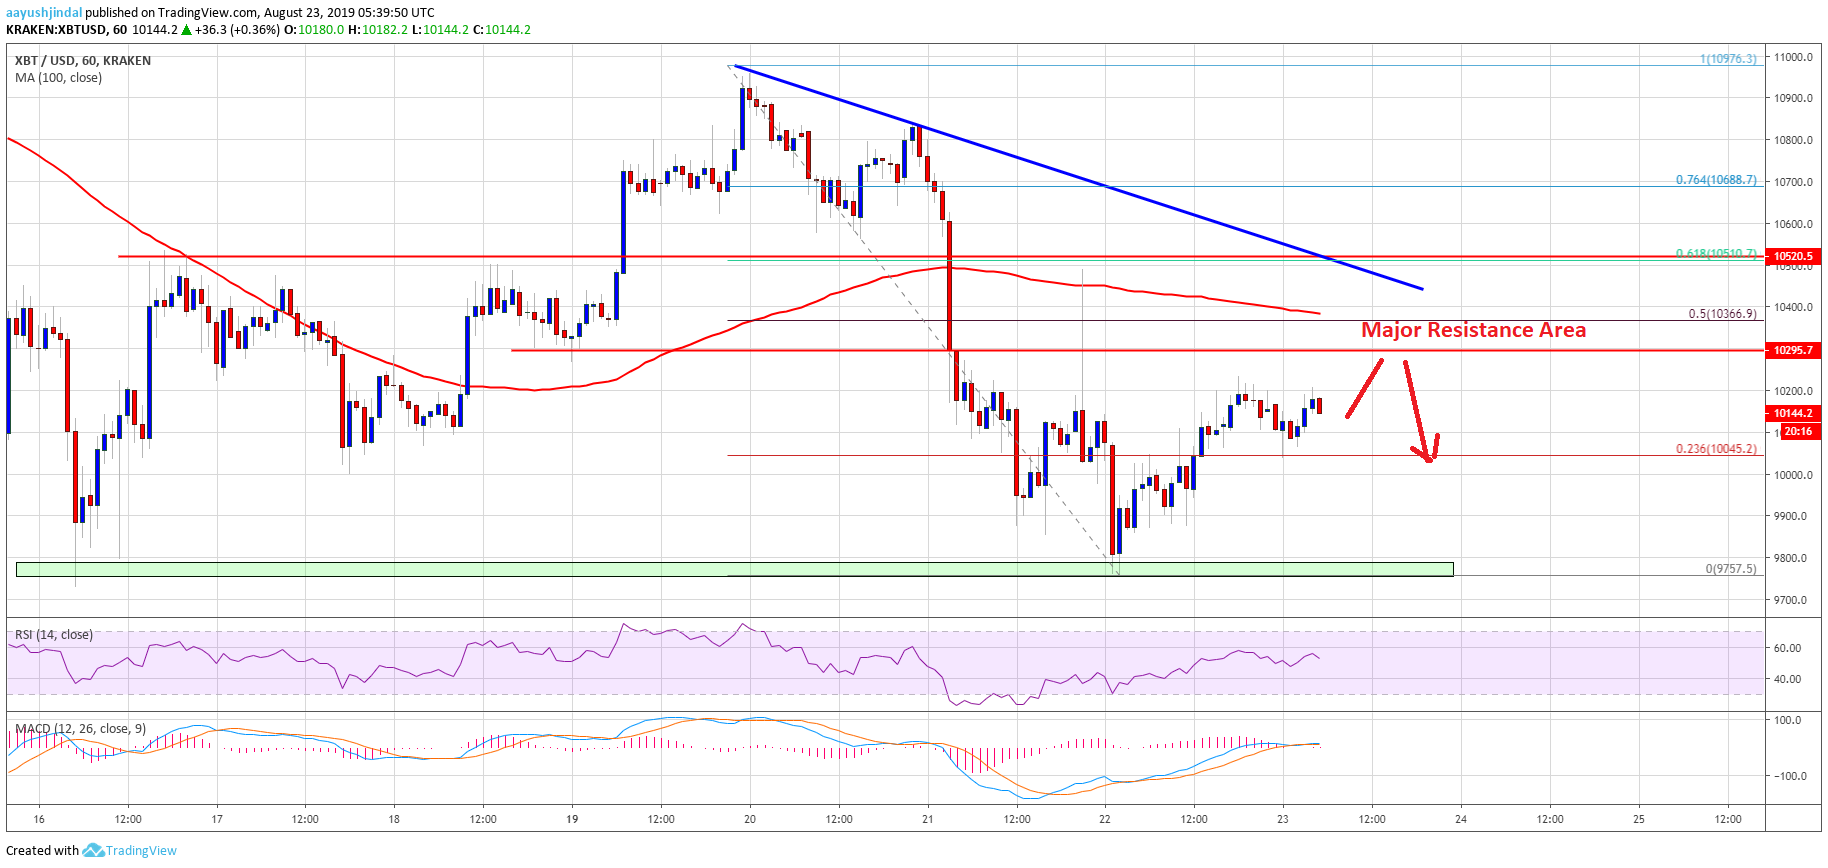 Looking at the chart, bitcoin price seems to be correcting higher towards the main barrier near the $10,300 and $10,400 levels. A successful close above the $10,400 level and the 100 hourly SMA may perhaps lead the price towards the $10,600 and $10,700 resistance levels. If not, there are high chances of a fresh decrease below the $10,000 and $9,850 levels.Technical indicators:Hourly MACD – The MACD is likely to move back into the bearish zone.Hourly RSI (Relative Strength Index) – The RSI for BTC/USD is currently declining towards the 50 level.Major Support Levels – $10,000 followed by $9,750.Major Resistance Levels – $10,200, $10,250 and $10,300.The post appeared first on NewsBTC


