
Bitcoin price failed to surpass the $11,000 resistance and recently declined against the US Dollar.The price is currently trading below the key $10,600 and $10,500 support levels.This week’s followed crucial bullish trend line was breached with support near $10,600 on the hourly chart of the BTC/USD pair (data feed from Kraken).The price is currently at a risk of more downsides below the $10,250 support area.Bitcoin price is currently facing an increase in selling below $10,500 against the US Dollar. Therefore, BTC could accelerate its decline if there is a break below $10,000.Bitcoin Price AnalysisYesterday, BTC climbed above the $10,800 resistance area against the US Dollar. However, the price struggled to gain momentum above the $10,950 and $11,000 levels. A swing high was formed near $10,960 and recently the price started a downside correction. Similarly, there were bearish moves in Ethereum and ripple below $200 and $0.2700 respectively in the past few sessions.Recently, bitcoin price declined below the main $10,600 and $10,500 support levels. Moreover, this week’s followed crucial bullish trend line was breached with support near $10,600 on the hourly chart of the BTC/USD pair. The pair is now trading below the 23.6% Fib retracement level of the upward move from the $9,488 low to $10,960 high.Furthermore, there was a close below the $10,400 level and 100 hourly simple moving average. An immediate support is near the $10,200 level. It coincides with the 50% Fib retracement level of the upward move from the $9,488 low to $10,960 high. If there are more downsides, the price could decline further towards the $10,000 support. The stated $10,000 support holds a lot of significance in the near term.If the price fails to stay above the $10,000 support, it could revisit the $9,488 swing low. Additionally, the price may even tumble below the $9,488 low and trade to a new monthly low. Conversely, if there is an upside correction, the price could test the $10,400 and $10,500 resistance levels. Additionally, the main resistance is near the $10,600 level and the 100 hourly simple moving average.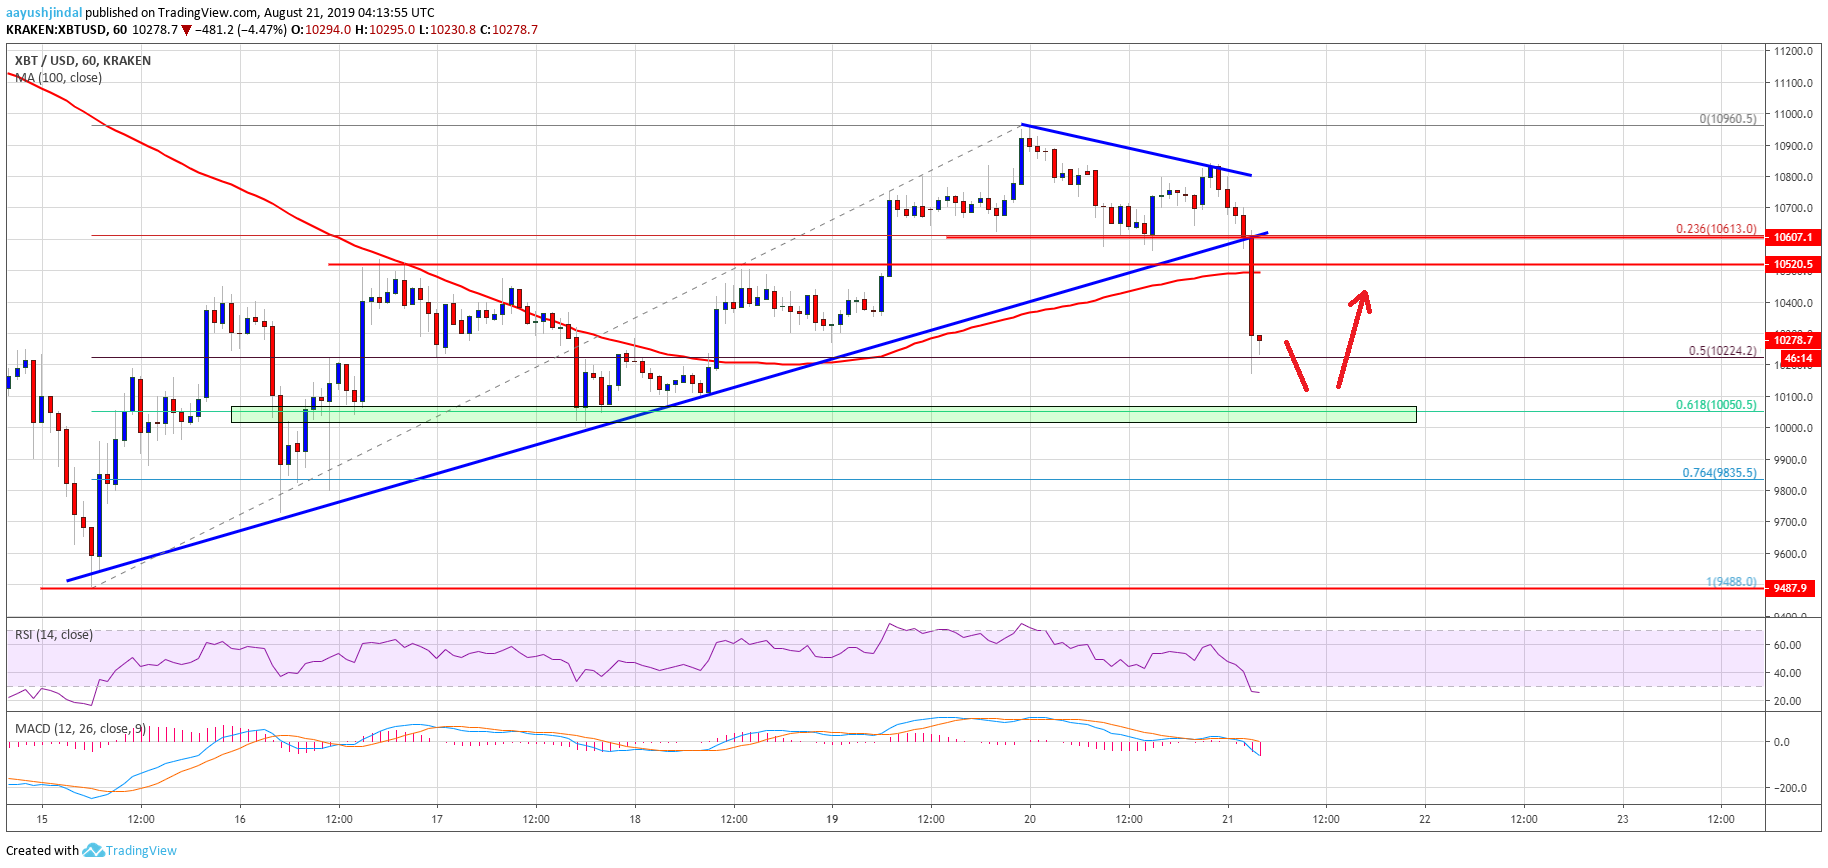 Looking at the chart, bitcoin price is facing a solid rise in selling pressure below $10,500. Therefore, there is a risk of more downsides below the $10,200 support. More importantly, a successful break below the $10,000 support might start a strong downward move. The next stop for the bears could be $9,500 and $9,200 in the coming sessions.Technical indicators:Hourly MACD – The MACD is gaining momentum in the bearish zone.Hourly RSI (Relative Strength Index) – The RSI for BTC/USD is currently declining sharply below the 40 level.Major Support Levels – $10,200 followed by $10,000.Major Resistance Levels – $10,400, $10,500 and $10,600.The post appeared first on NewsBTC


