
There was a steady rise in bitcoin price above the $10,500 resistance against the US Dollar.The price is currently correcting lower after it traded to a new monthly high close to $11,000.There is a key bullish trend line forming with support near $10,200 on the 4-hours chart of the BTC/USD pair (data feed from Kraken).There could be a downside correction towards the $10,100 support area before a fresh increase.Bitcoin price is trading with a bullish bias above $10,000 against the US Dollar. BTC remains buy on dips as long as there is no daily close below $10,000.Bitcoin Price Weekly Analysis (BTC)In the last weekly forecast, we discussed the importance of the $10,000 resistance for bitcoin price against the US Dollar. The BTC/USD pair remained well bid and managed to surpass the $10,000 resistance. Moreover, there was a break above the $10,500 resistance and the 100 simple moving average (4-hours). Finally, the price climbed above the $10,800 level and traded close to the $11,000 level.A swing high was formed near $10,949 before the price started a downside correction. There was a sharp decline below the $10,800 and $10,500 support levels. Moreover, there was a break below the 23.6% Fib retracement level of the last wave from the $9,300 low to $10,949 high. Finally, there was a break below the $10,400 level. However, the price stayed above the $10,000 support and the 100 SMA.Additionally, the price is trading nicely above the 50% Fib retracement level of the last wave from the $9,300 low to $10,949 high. There is also a key bullish trend line forming with support near $10,200 on the 4-hours chart of the BTC/USD pair. If there is a downside break below the trend line support, there could be a sharp decline below $10,000 in the near term.On the upside, an initial resistance is near the $10,600 level. If there is an upside break above $10,600, the price could revisit the $10,800 resistance. Finally, a close above the $11,000 level may perhaps set the pace for a larger upward move towards the $11,700 level.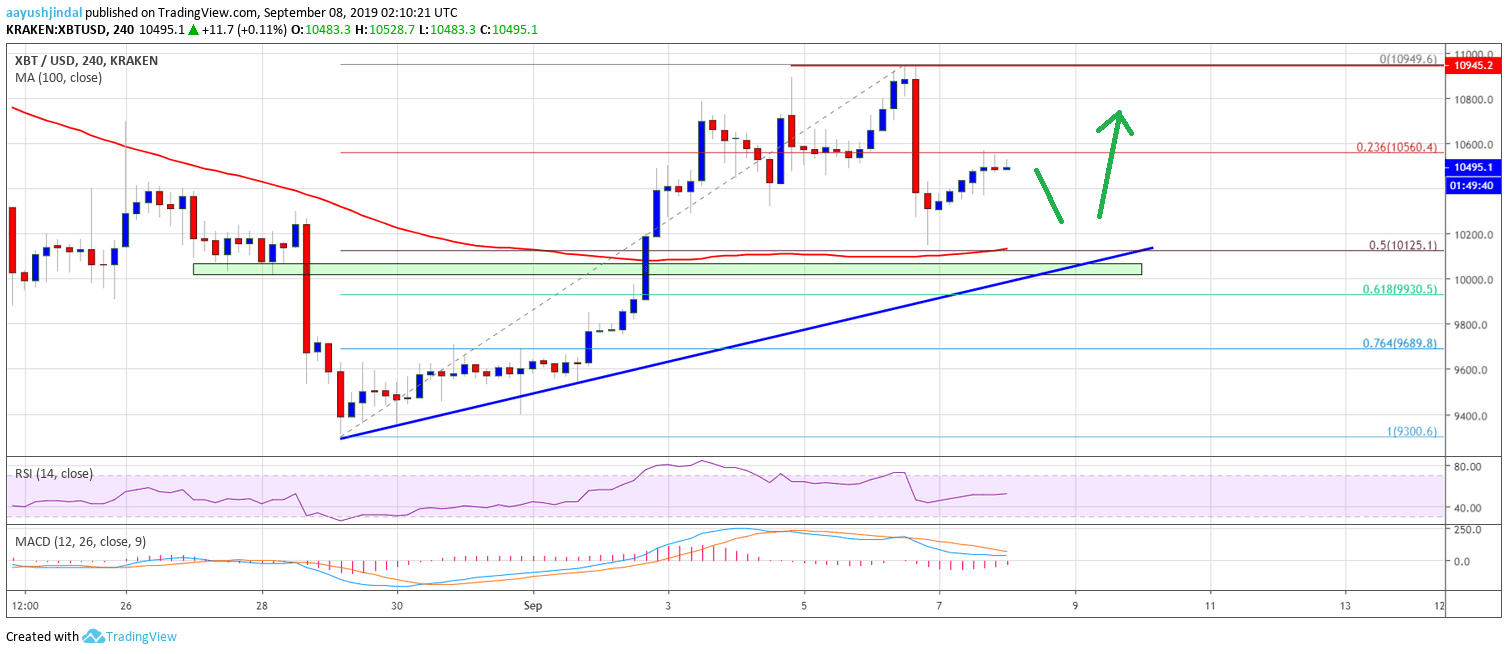 Looking at the chart, bitcoin price seems to be correcting gains, but it is trading nicely above the $10,200 support area. The main support is near $10,000, below which the price could turn bearish in the coming sessions. On the upside, the price might continue to struggle near $10,800 and $11,000. Overall, there could be another dip towards $10,100 before a fresh increase.Technical indicators4 hours MACD – The MACD for BTC/USD is about to move back into the bullish zone.4 hours RSI (Relative Strength Index) – The RSI for BTC/USD is slowly rising towards the 55 level.Major Support Level – $10,000Major Resistance Level – $10,800The post appeared first on NewsBTC


