
There was a downside extension in bitcoin price below the $10,000 support against the US Dollar.The price is currently consolidating and is facing many hurdles on the upside near $10,400.There is a crucial bearish trend line forming with resistance near $10,400 on the 4-hours chart of the BTC/USD pair (data feed from Kraken).There could be a strong upward move if the price surges above $10,400 and $10,500.Bitcoin price is facing an uphill task near $10,500 and $10,680 against the US Dollar. BTC remains in a downtrend unless the bulls gain strength above $10,500.Bitcoin Price Weekly Analysis (BTC)In the last weekly forecast, we discussed the chances of more downsides in bitcoin price below $10,500 against the US Dollar. The BTC/USD pair did extend its decline and traded below the $10,200 and $10,000 support levels. The decline was such that the price even spiked below the $9,800 support level. Moreover, there was a close below the 100 simple moving average (4-hours) and the last swing low was formed near $9,757.The price recovered above the $10,000 level plus the 23.6% Fib retracement level of the recent drop from the $10,964 high to $9,757 low. However, the upward move was capped near the $10,400 and $10,500 resistance levels. Moreover, the price struggled to gain momentum above the 50% Fib retracement level of the recent drop from the $10,964 high to $9,757 low.Clearly, there is a strong resistance forming near $10,400 and $10,500. More importantly, there is a crucial bearish trend line forming with resistance near $10,400 on the 4-hours chart of the BTC/USD pair. Above the trend line, the next key resistance is near the $10,680 level and the 100 simple moving average (4-hours). It also coincides with the 76.4% Fib retracement level of the recent drop from the $10,964 high to $9,757 low.Therefore, an upside break above $10,500 and $10,680 could spark a strong upward move in bitcoin. The next stop for the bulls could be near the $10,900 and $11,000 levels. Conversely, if the price struggles to gain traction above $10,400 and $10,500, there could be a fresh decline. An immediate support is near the $10,000 level. However, the main support is near the $9,800 area, below which the price could tumble.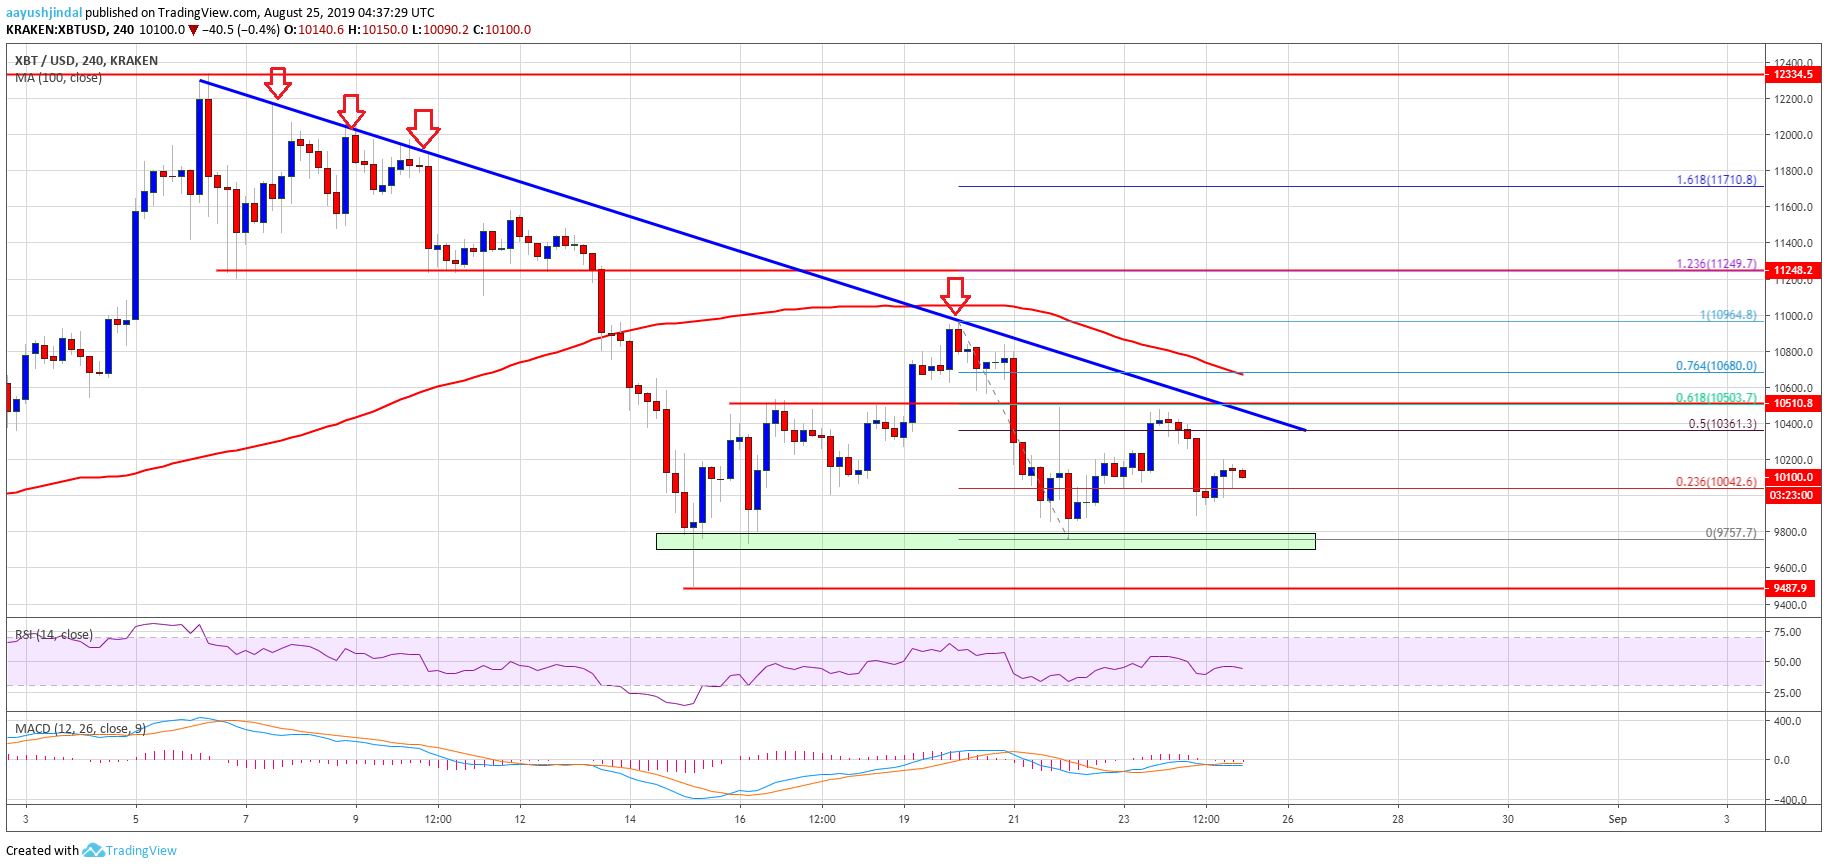 Looking at the chart, bitcoin price is facing an uphill task near $10,400 and $10,500. Until there is a close above $10,500, the bears remain in actionTechnical indicators4 hours MACD – The MACD for BTC/USD is struggling to move into the bullish zone.4 hours RSI (Relative Strength Index) – The RSI for BTC/USD is currently well below the 50 level.Major Support Level – $9,800Major Resistance Level – $10,500The post appeared first on NewsBTC


