
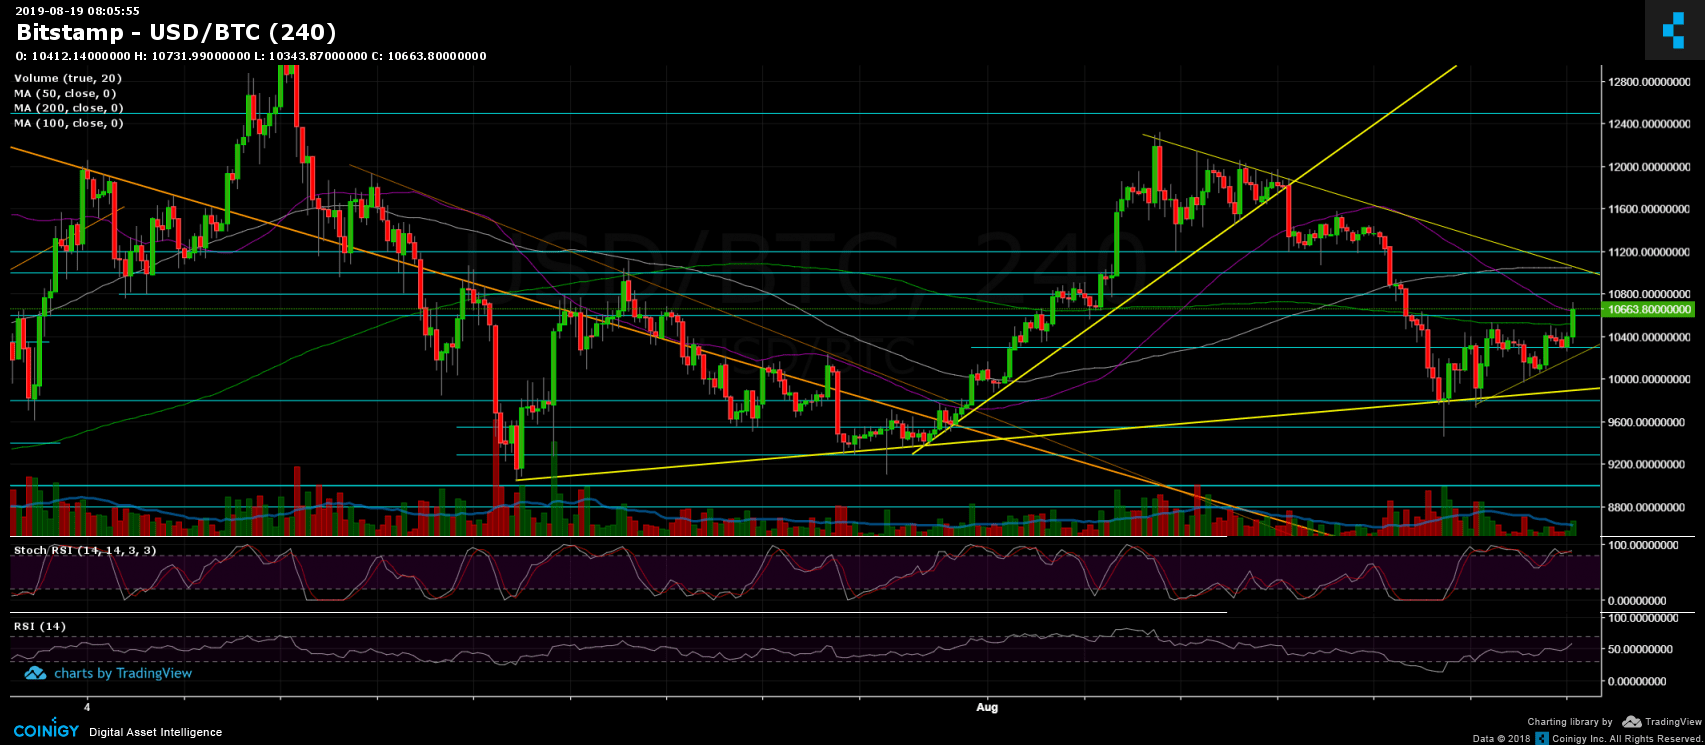
Over the past four days and since producing the Doji candle on the 4-hour chart, we have seen Bitcoin going through a beautiful bullish setting of higher lows. As mentioned in our previous analysis, Bitcoin found decent support by the mid-term ascending trend-line (marked yellow) from below.
This setting was ‘roofed’ by the 200 moving average line (light green) on the 4-hour chart, which got rejected twice over the past four days. However, as we write this update, we saw Bitcoin finally breaking up the line, on its way north.
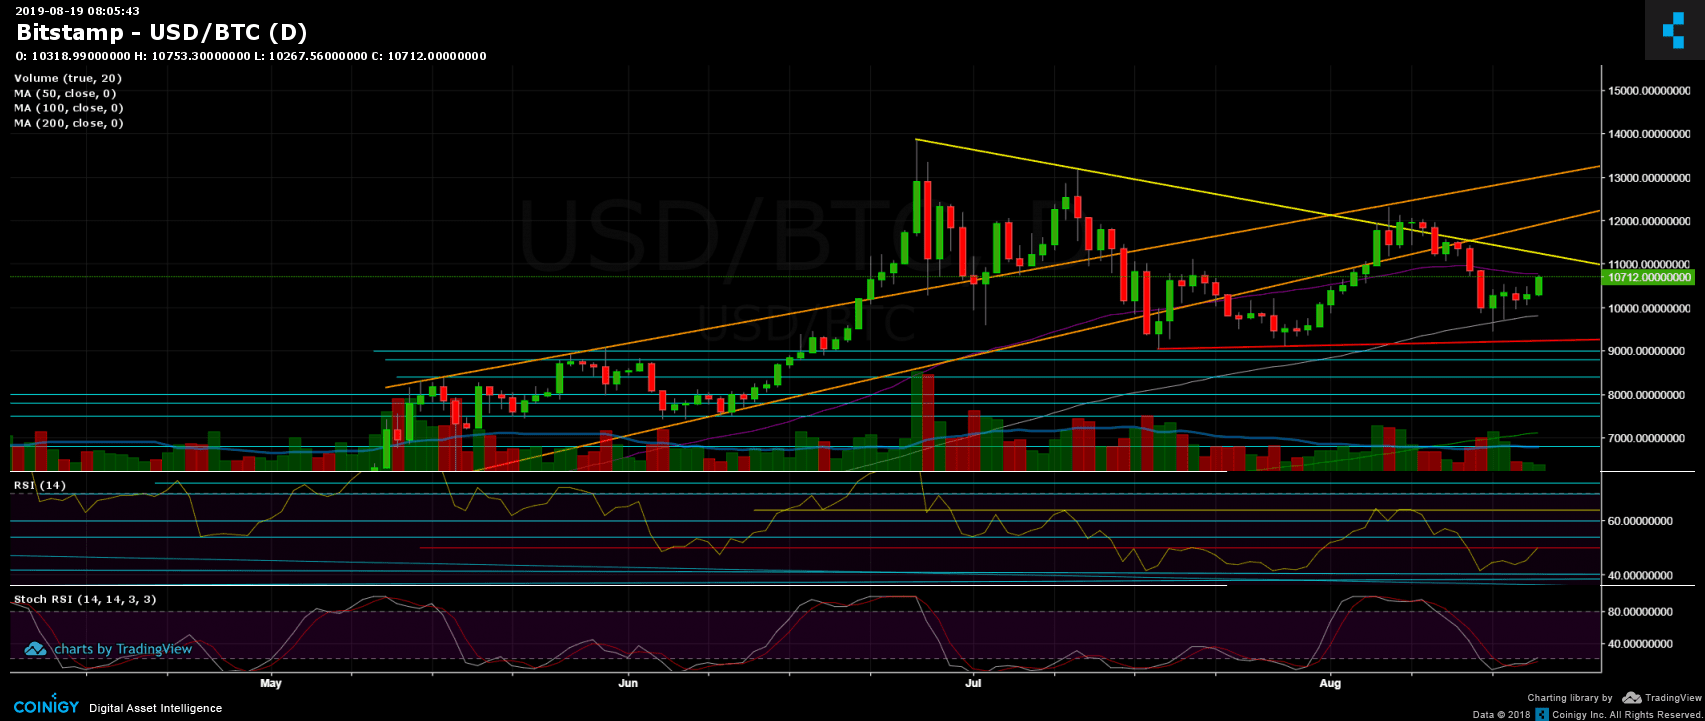
As of now, Bitcoin is facing the next major resistance level of $10,800, along with the 50-days moving average line (marked purple on the daily chart).
Total Market Cap: $278 billion
Bitcoin Market Cap: $191 billion
BTC Dominance Index: 68.7%
*Data by CoinGecko
Key Levels to Watch
– Support/Resistance:
Following the breakout, the first level of resistance turned support is now the horizontal $10,550 area, along with the MA-200 as mentioned above (marked by a light-green line on the 4-hour chart). Below, the area of $10,200 – $10,300 is the next line of support. Further below is $10,000 and $9,800 (the 100-days moving average line). Below lies $9600 and $9400 (the weekly low).
From the bullish side, after $10,800 (daily MA-50), lies the $11,000 – $11,200 resistance range, which also contains the descending trend-line, which was started forming amid the 2019 high of $13,880. In case of a break-up, we should expect the next resistance level to be $11,500 – $11,600 zone.
– Daily chart’s RSI: The recent bullish move had brought the RSI precisely to the 50-resistance level. This could be a significant area (along with the above-mentioned resistance for Bitcoin). As mentioned already, positive remarks came from the Stochastic RSI oscillator, which had made a cross-over at the oversold territory and about to enter the bullish zone.
– Trading Volume: The past two days during the weekend saw a very low amount of trading volume (as expected). In case Bitcoin bulls want to control the overall market movements, today’s candle needs to end-up a lot higher than the weekend’s.
BTC/USD BitStamp 4-Hour Chart
BTC/USD BitStamp 1-Day Chart
More news for you:


The post appeared first on CryptoPotato


