
The prices might go helter-skelter on the short-term chart, but since the start of September, Bitcoin Cash has only witnessed sideways movement on the daily time period. A fixed range between $237 and $200 is evident in the charts while a long-term breakout is yet to take place.
Bitcoin Cash 1-day chart
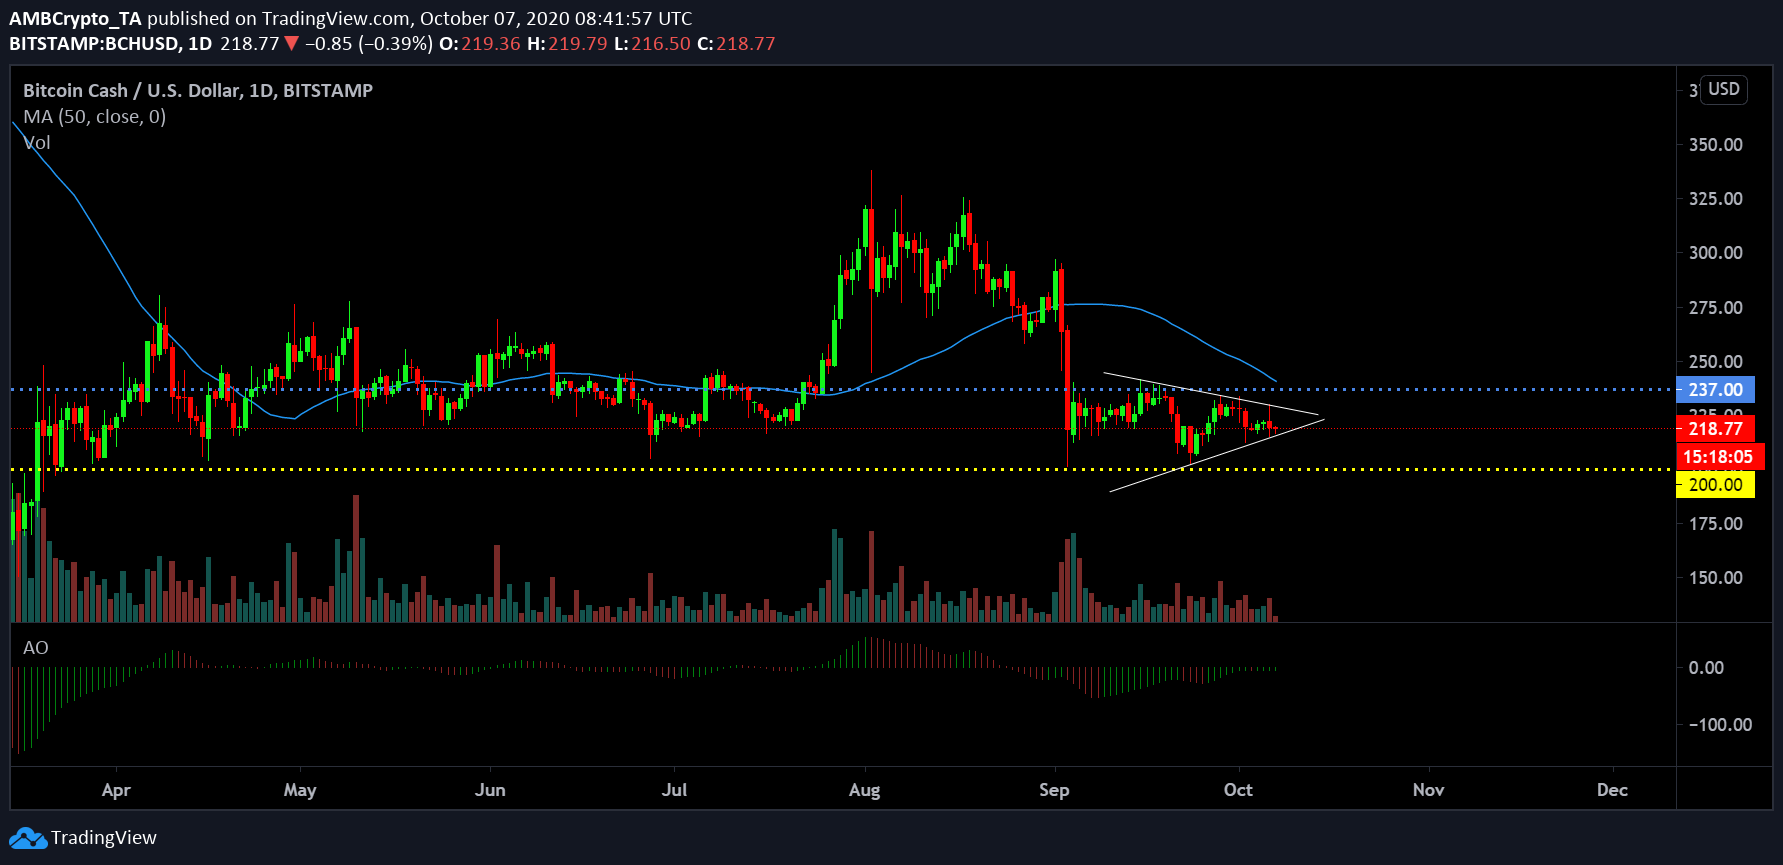
As mentioned above, BCH has oscillated within the range of $237-200 over the past few weeks. Its sideways movement has led to the formation of a symmetrical triangle which appears to near a definite breakout over the next few days. While a symmetrical triangle may pave the path for both a bearish and bullish trend, the 50-Moving Average is currently thrusting high selling pressure in the charts. With the volumes threading low activity in the markets, the chances of a breakout are definitely high as well.
Awesome Oscillator remains mildly bullish and borderline neutral with green candles completing the last few days of trading. However, if the chart is observed on a larger time-frame, the probability of another huge bullish breakout can be observed.
Bitcoin 1-day chart [2019 – present day]
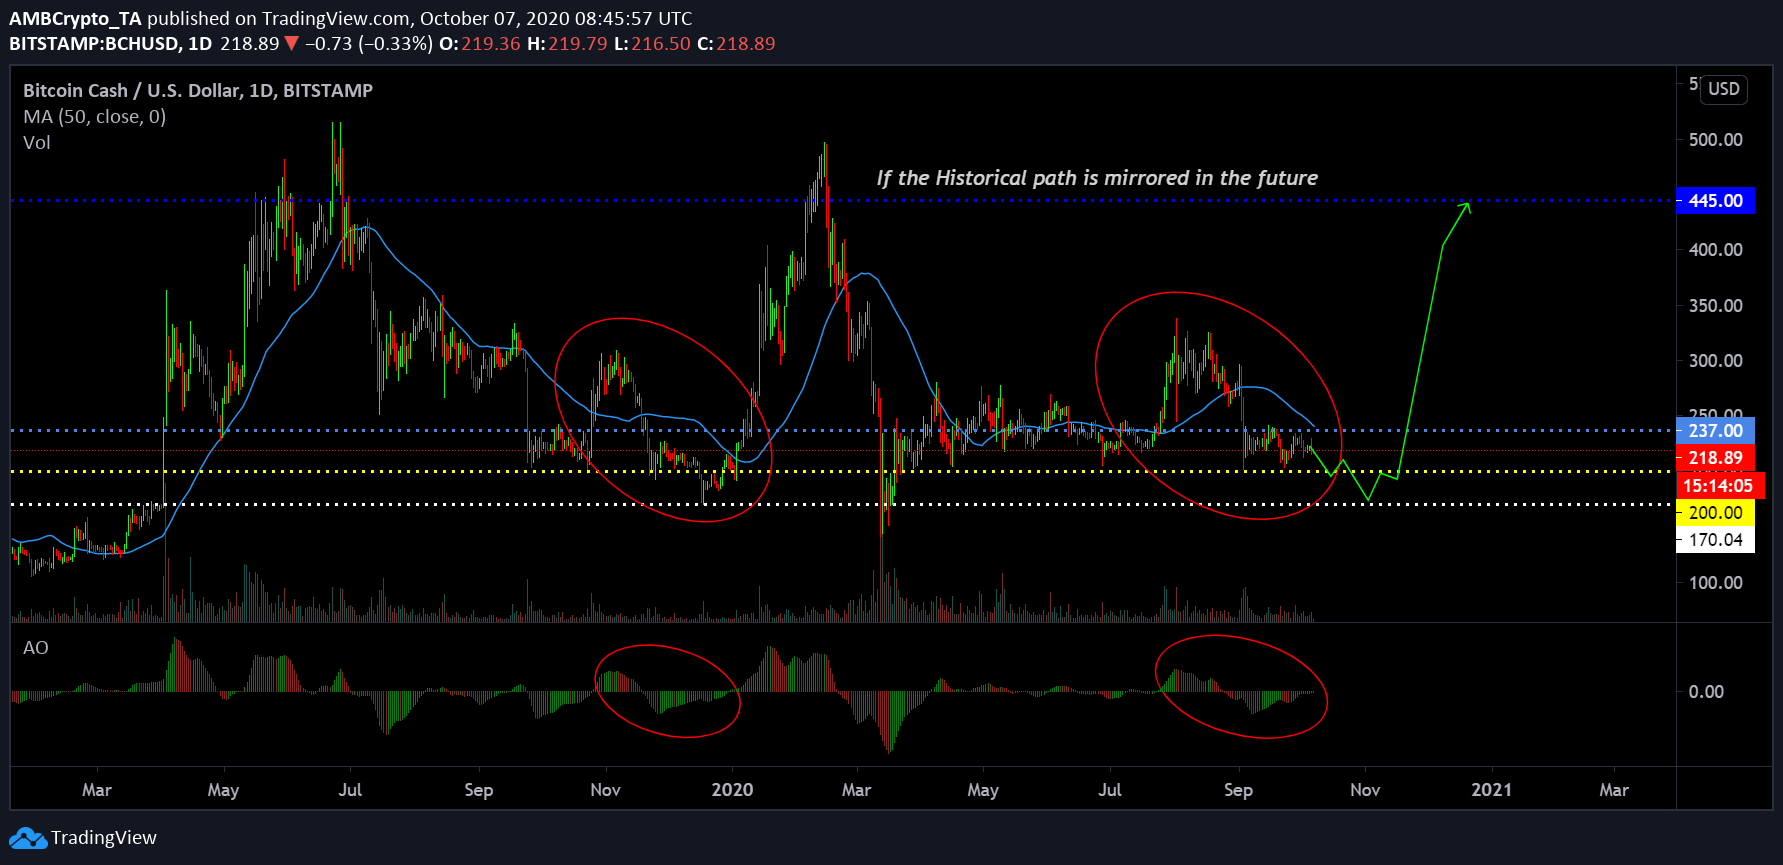
The above chart is a representation of Bitcoin-Cash’s movement between March 2019 to press time. As highlighted in the chart by the red ellipse, BCH’s movement late-November 2019 mirrors the current market structure. The Awesome Oscillator is manifesting a striking resemblance as well. Now if the historical price path of BCH is followed in the current market, BCH may likely touch down on its long-term support at $170 over the next few weeks.
However, towards the end of the year, the bulls may play in their heavy hand, and the BCH‘s value may attain its new-all time highs in 2020, surpassing $337 registered on 3rd August.
While the Moving Average continues to inflict solid selling pressure, it was the exact same in November 2019 as well. With the majority of the space inclined towards an imminent Bitcoin bull-run, BCH surpassing its 2020 years is a fairly estimated target as correlation with the king coin remains intact.
The post appeared first on AMBCrypto


