
- The price increased by 7% to reach $265 today after facing tough resistance at $230
- Bitcoin Cash is ready for a long-term move, but it would need to surpass crucial resistance at $281
- Against Bitcoin, the price breaks away from a bearish zone after a 3% increase
BCH/USD: BCH Is Slowly Rising Back
Key Support Levels: $281, $352
Key Resistance Levels: $222, $200

In May, Bitcoin Cash found support at $222 after being rejected at the $281 resistance level three times. The price bounced back and traded between $237 and $253 before breaking out today. BCH is currently trading around $264 with a 9% surge. BCH is again charging towards the $281 resistance level.
A successful break would signal a long-term move for the 5th largest cryptocurrency. Regardless of the possible rejections ahead, BCH is currently bullish and ready for more gains in the coming weeks.
Bitcoin Cash Price Analysis
BCH is currently trading in a supply zone, marked grey on the daily chart. Once the price increases above this area, the next primary target for the bulls is $352. After this, resistance is found at $406 and $495.
Toward the downside, immediate support lies at $222, followed by the psychological level of $200. If it breaks, the price may drop further to $191 and $168. But with the current market structure, BCH’s setup looks bullish at the moment.
BCH/BTC: BCH Is Breaking Out
Key Support Levels: 0.0275 BTC, 0.0280 BTC
Key Resistance Levels: 0.0255 BTC, 0.0246 BTC
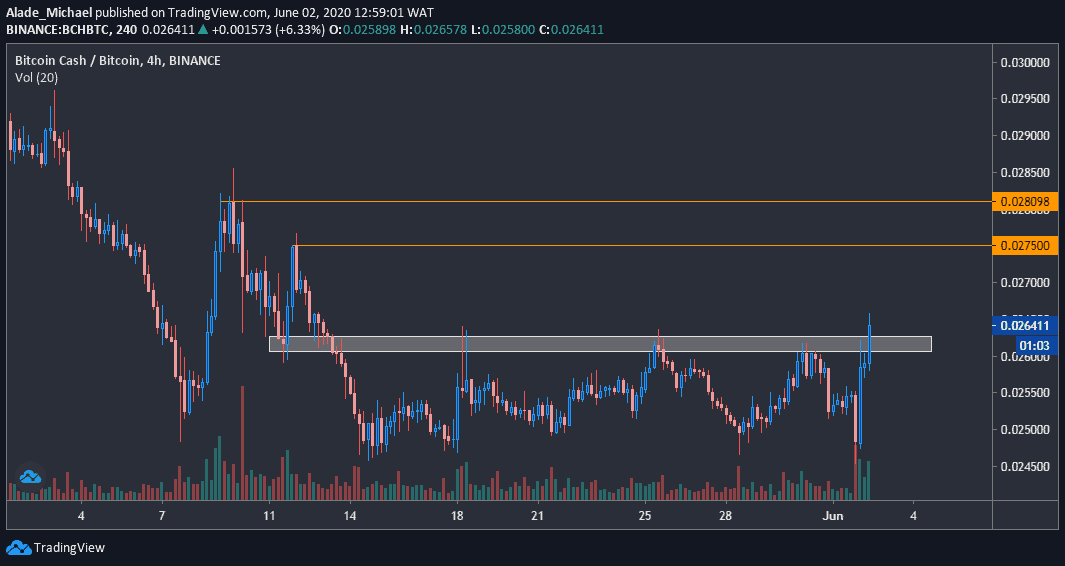
Following Bitcoin’s dramatic increase to $10,350 today, Bitcoin Cash saw a quick 3% jump to reach 0.0265 BTC. This increase was led by a slight breakout after struggling under 0.026 BTC for the past two weeks. As of now, it is priced at 0.0264 BTC.
Meanwhile, the major recovery was plotted from around 0.0246 BTC, where it found support since May. The bulls are slowly getting back in the market, but they still need to push above the resistance level at 0.0285 BTC before confirming a nice reversal.
It may continue to move sideways if the bulls fail to sustain the price above the grey-marked zone in the above chart. The buyers are showing commitment at the moment, but it is not enough to validate a strong reversal until the price closes definitively above the mentioned resistance.
Bitcoin Cash Price Analysis
The breakout is still looking shaky at the moment. However, a proper close above the grey zone could propel buying pressure to the orange-marked lines of $0.0275 BTC and 0.0280 BTC.
If this move happens to be a fake-out, Bitcoin Cash may fall back under this grey zone as the price could revisit 0.0255 BTC. It may even drop to the support at 0.0246 (last month’s low). A dip beneath this may set a fresh decrease in its value. The trading volume is currently low.
The post Bitcoin Cash Price Analysis: BCH Eyes $280 After Surging 9% In The Last 24 Hours appeared first on CryptoPotato.
The post appeared first on CryptoPotato


